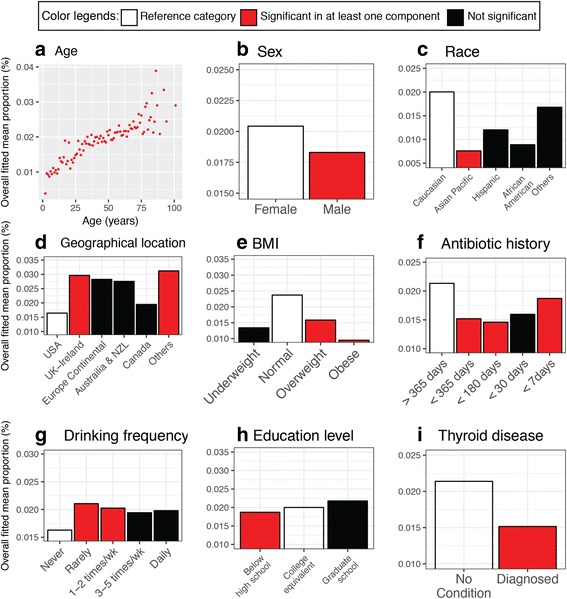
Fig. 3.

Predicted relationships between O. formigenes abundance and host features by the ZINB model. a–i The overall fitted mean proportions (%) of O. formigenes were plotted as functions of nine significant covariates in the ZINB model fitted with 4945 AGP fecal samples. For each covariate, categories are color-coded by reference (white), not significant (black), or significant in either logistic or negative binomial regression component (red). Panels focus on covariate age (a); sex (b); race (c); geographical location (d); BMI (Underweight, Normal, Overweight and Obese groups are classified based on BMI ≤18.5, 18.5–25, 25.1–30, and >30, respectively) (e); last exposure to antibiotics (f); alcohol consumption frequency (groups of rarely, occasionally, regularly consuming are defined as a few times/month, 1–2 times/week, and 3–5 times/week) (g); education level (h); and whether has thyroid disease (i)
