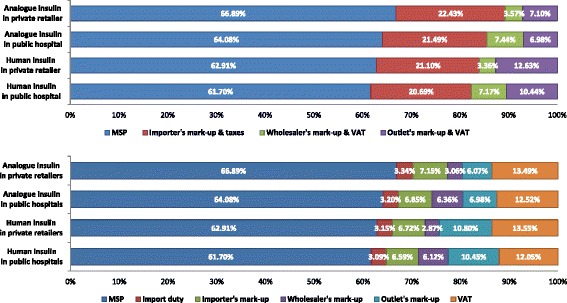
Fig. 1.

Contribution of price components to the final patient price of insulin. The first histogram indicated the original stakeholders’ contribution (with taxes) to the final prices. To show the impact of tax, import duty and value added tax was extracted and the second histogram showed the mark-ups of different stakeholders (without tax) and cumulative contribution of taxes
