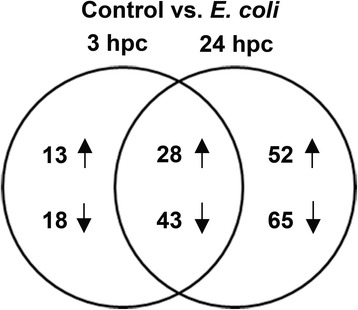
Fig. 1.

Differentially expressed mature miRNAs following pathogen stimulus. Venn diagram showing miRNAs DE in PMECs at 3 hpc and 24 hpc with E. coli (p < 0.05; fold change >1.5 or < −1.5; N = 3), compared to unchallenged controls. Numbers in the intersecting circles represent miRNAs that were commonly regulated at both challenge times
