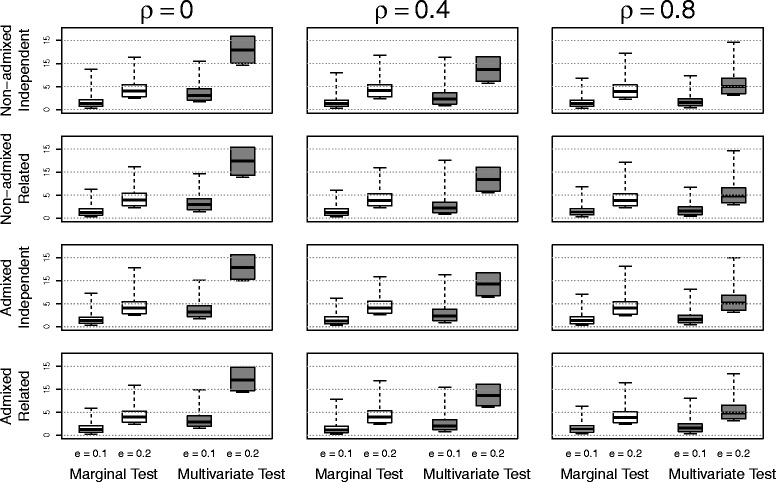
Fig. 6.

The distribution of values of − log10(p) using samples with different population structures and relatedness for various correlations ρ between phenotypes under the alternative hypotheses: the effect size e=0.1,0.2. The white boxes correspond to the marginal test; and the gray boxes correspond to the multivariate test
