
Fig. 9.
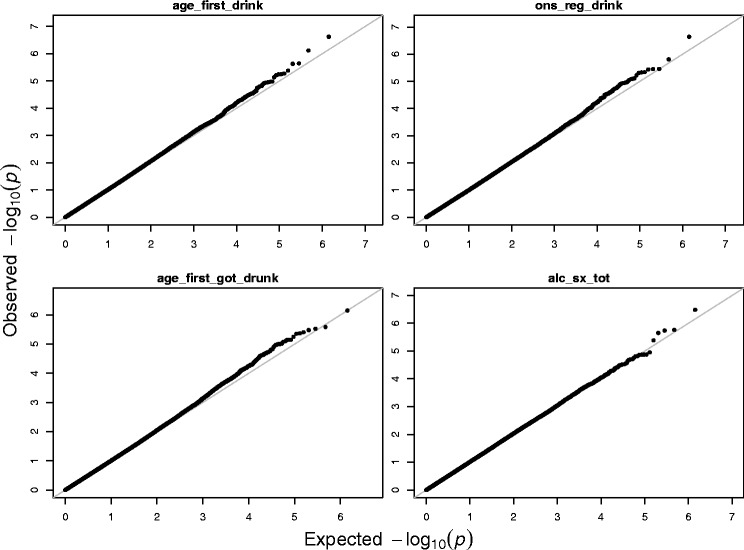
The QQ-plots of − log10(p)-values from marginal tests for four alcohol dependence phenotypes using real data from 4121 participants
Official websites use .gov
A
.gov website belongs to an official
government organization in the United States.
Secure .gov websites use HTTPS
A lock (
) or https:// means you've safely
connected to the .gov website. Share sensitive
information only on official, secure websites.
The QQ-plots of − log10(p)-values from marginal tests for four alcohol dependence phenotypes using real data from 4121 participants