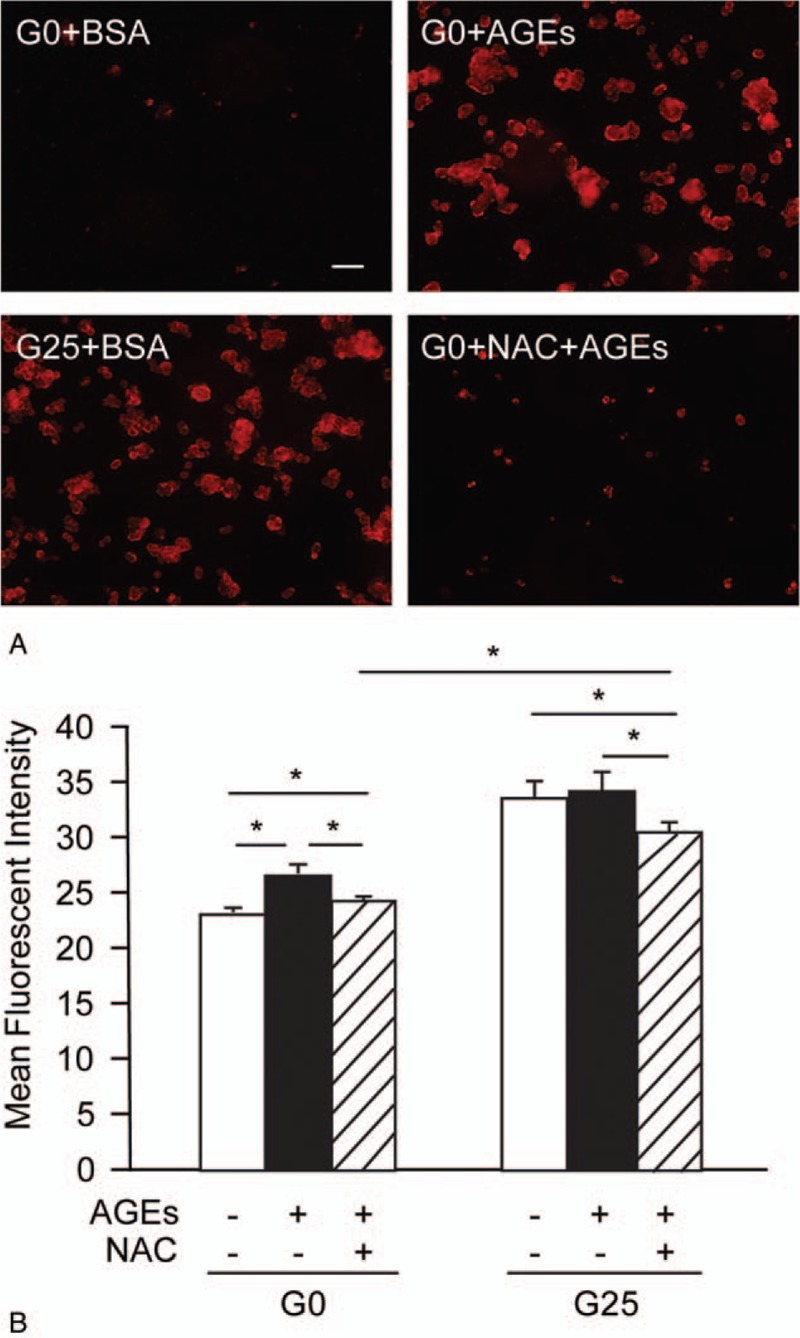
Figure 3.

AGEs stimulated ROS generation in HepG2 cells. (A) ROS production detected by a DHE probe using fluorescence microscopy in HepG2 cells treated with either 200 mg/L BSA or 200 mg/L AGEs under 0 mM (G0) or 25 mM (G25) glucose conditions for 24 hours. The scale bar is 20 μm. (B) Intensity of DCFH fluorescence for HepG2 cells with or without 100 μM NAC treatment before being cultured in either the BSA (−) or AGEs (+) under 0 mM (G0) or 25 mM (G25) glucose conditions for 24 hours. Asterisk (∗) indicates P < .05. The difference between the 2 shading bars is also statistically significant. AGEs = advanced glycation end products, BSA = bovine serum albumin, DCFH = dichlorodihydrofluorescein diacetate, DHE = dihydroethidium, ROS = reactive oxygen species.
