Figure 4.

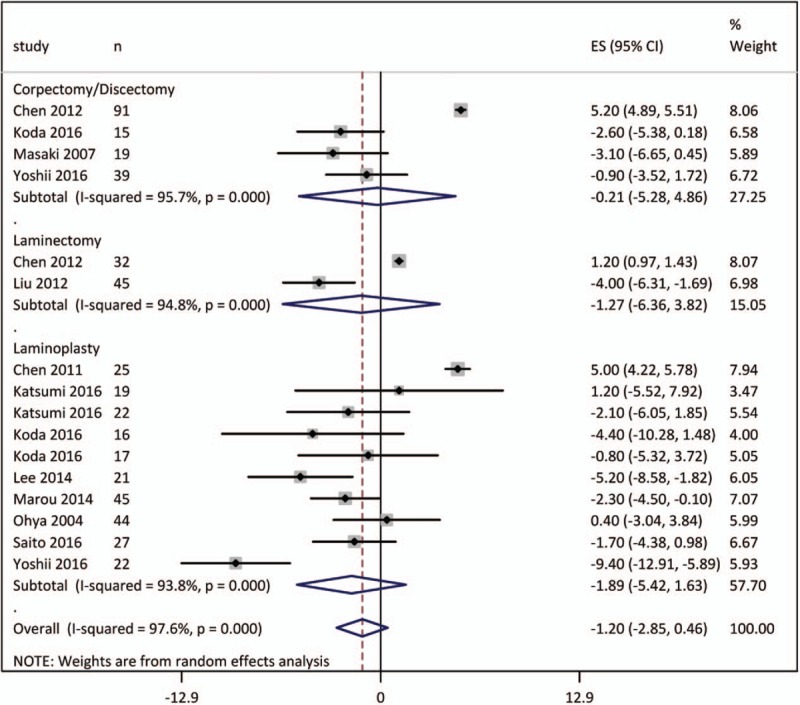
Forest graph showing the overall effect size of the meta-analysis of the change lordosis angle at the latest follow-up along with subgroup effect sizes.

Forest graph showing the overall effect size of the meta-analysis of the change lordosis angle at the latest follow-up along with subgroup effect sizes.