
Figure 6.
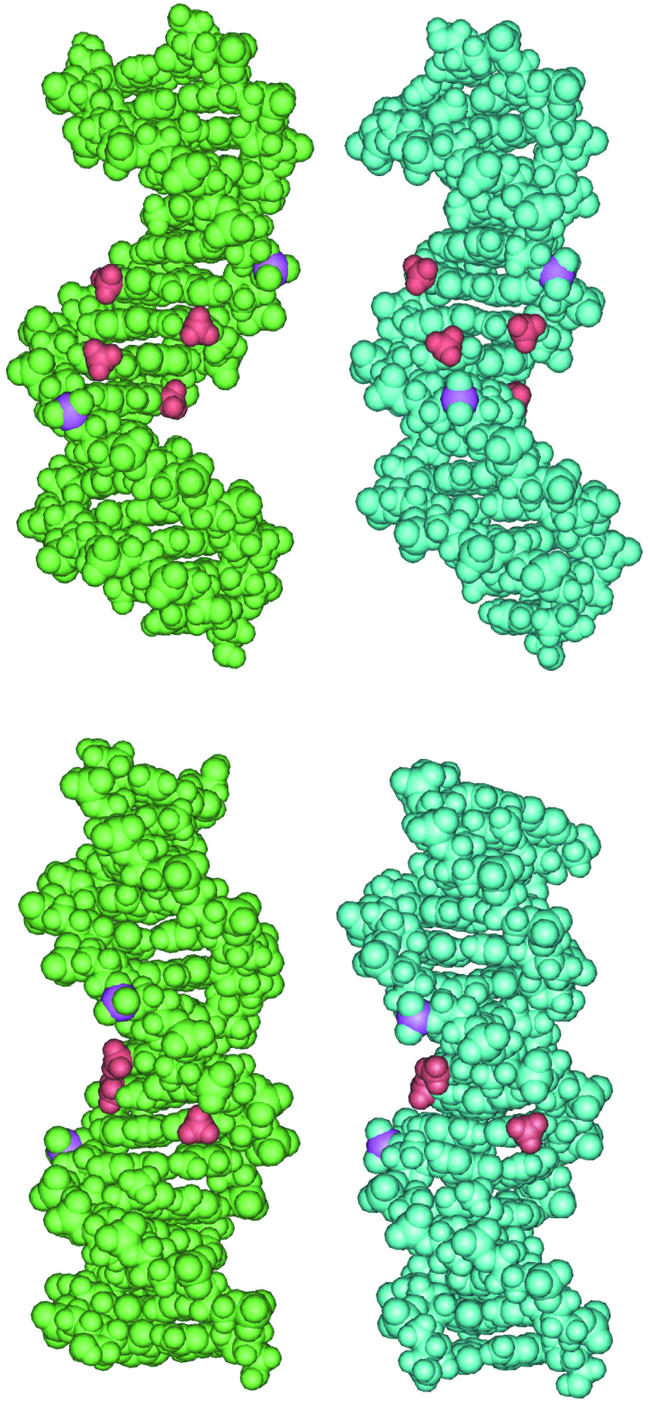
Snapshots from the MD trajectory of CREmet for the BIBI (t = 4301 ps) (left) and the BIIBII (t = 4440 ps) (right) sub-conformations. The phosphorus atoms at the GpA steps are pink, and the methyl groups at AmCGT in the center of CREmet are red. Front (top) and profile (bottom) views of the major groove.