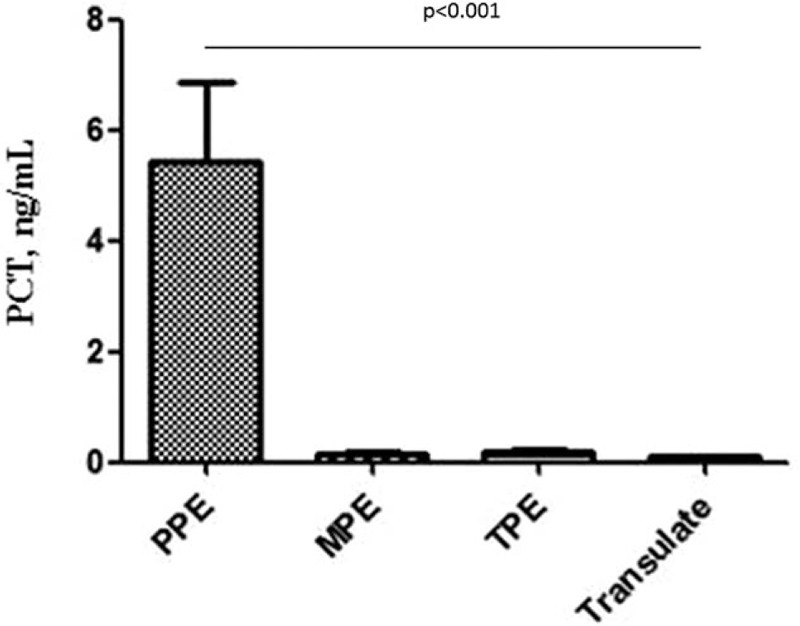
Figure 1.

Comparisons of s-PCT levels in patients between PPE and non-PPE groups. The levels of PCT for PPE, MPE, TPE, transudate groups were 5.44 ± 9.82, 0.15 ± 0.19, 0.18 ± 0.16, and 0.09 ± 0.03 ng/mL, respectively. MPE = malignant pleural effusion, PCT = procalcitonin, PPE = parapneumonic pleural effusion, s-PCT = serum procalcitonin, TPE = tuberculous pleural effusion.
