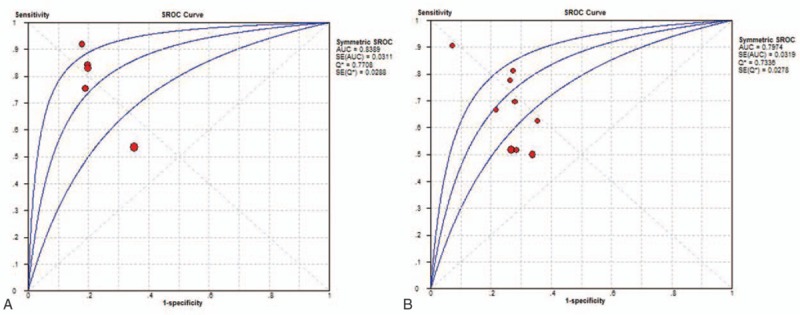
Figure 3.

SROC curves for s-PCT and p-PCT as a diagnostic biomarker for PPE. The overall AUCs for s-PCT (A) and p-PCT (B) are 0.84 and 0.80, respectively. AUC = area under the curve, p-PCT = pleural procalcitonin, PPE = parapneumonic pleural effusion, s-PCT = serum procalcitonin, SROC = summary receiver operating characteristic.
