
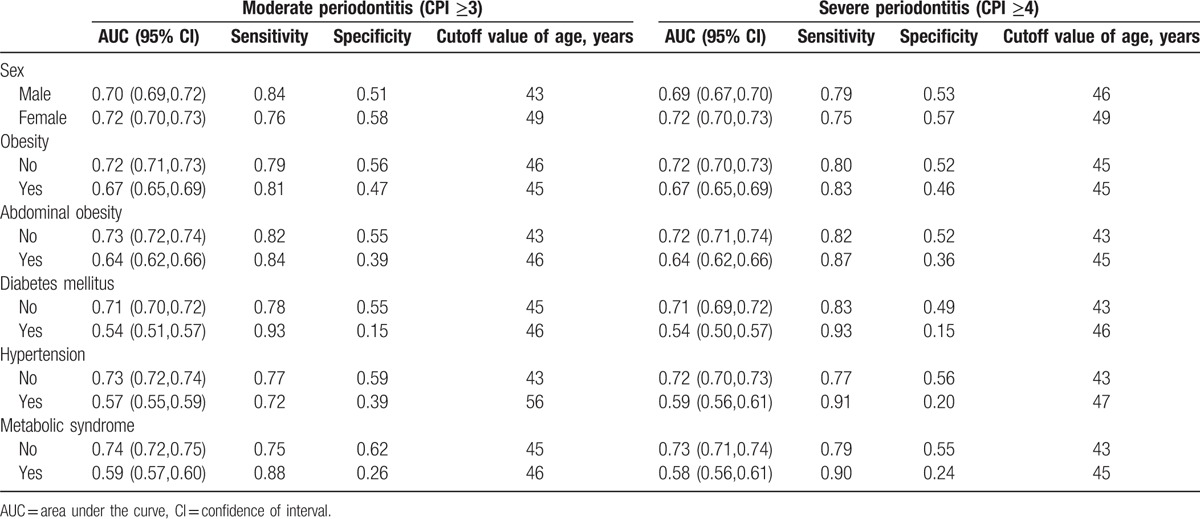
Table 2.
Area under the curve, sensitivity, and specificity of the studied individuals categorized by sex, presence of obesity, and the presence of systemic diseases.
Official websites use .gov
A
.gov website belongs to an official
government organization in the United States.
Secure .gov websites use HTTPS
A lock (
) or https:// means you've safely
connected to the .gov website. Share sensitive
information only on official, secure websites.
Area under the curve, sensitivity, and specificity of the studied individuals categorized by sex, presence of obesity, and the presence of systemic diseases.