
Figure 10.
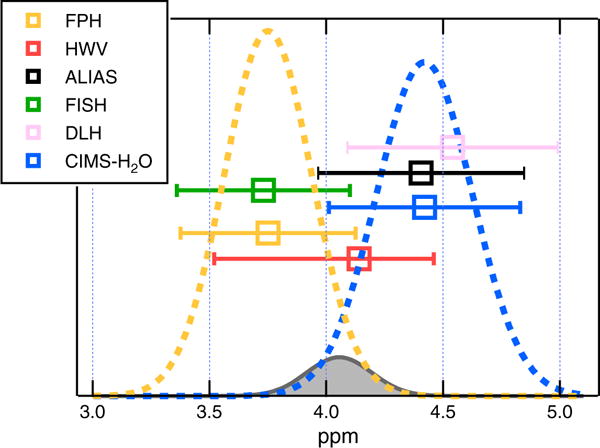
Measurement spread from 23 April final descents from 16.7 to 16.5 km. Box and whiskers show measurement mean with stated uncertainty range. For this case all instrumental error estimates overlap near 4.1 ppmv. For FPH and CIMS the dashed lines show normal distributions about the mean values illustrating the PDF of WV values implied by the stated uncertainties. The product of the PDFs (gray) is the probability of agreement between FPH and CIMS-H2O, which in this case is 5.7%. We note that the asymmetric uncertainties for HWV could not be approximated by a normal distribution as is done here for FPH and CIMS.