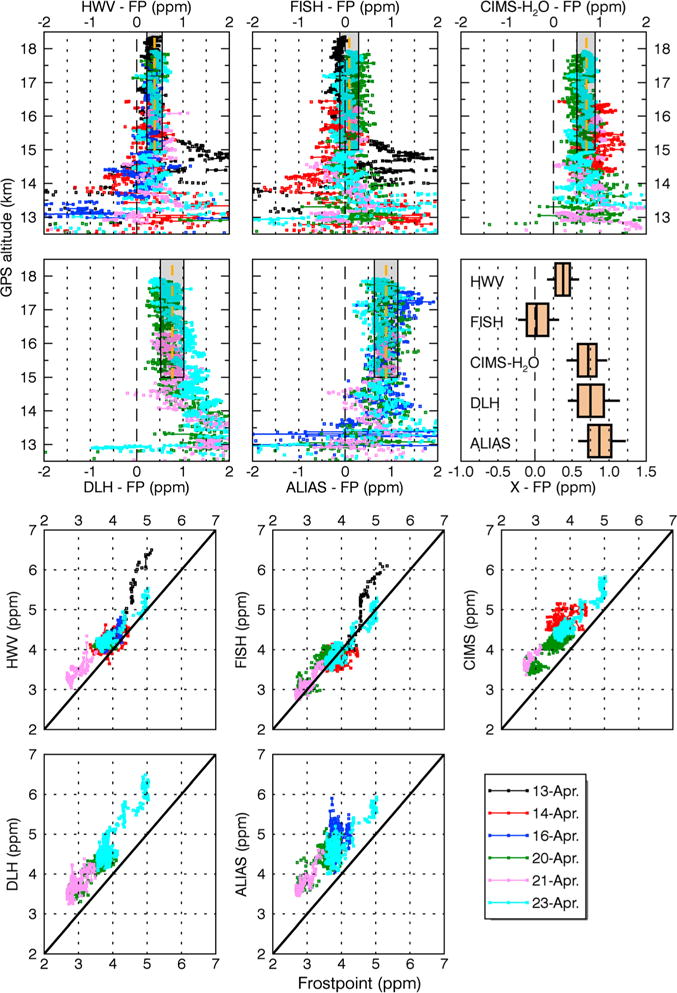
Figure 8.

Comparison between the frost point balloon measurements and FISH, CIMS-H2O, HWV, ALIAS, and DLH. Data are for all FP flights in Table 5. Data are restricted to altitude above 15km. (top six panels) Difference between WB-57F and FP data. Orange dash shows average and gray box standard deviation. Summary panel (box and whiskers) shows 25–75 percentile (boxes) and 10–90 percentile (whiskers) for all measurements excluding 13 April data. Marker colors indicate flight day. (bottom six panels) Scatter plots comparing matched FP and WB-57F data. Solid lines indicate 1:1 line.
