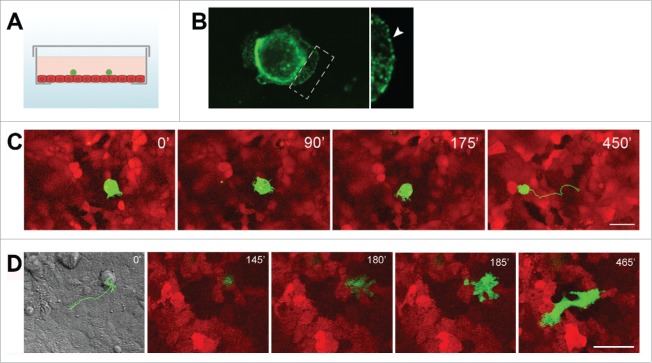
Figure 2.
Interactions between transformed IAR-6–1 epithelial cells and normal IAR-2 epithelial cells. (A) A scheme of the experimental design: a glass bottom culture dish with a confluent IAR-2 monolayer (red) and transformed IAR cells (green) seeded sparsely onto the monolayer. (B) Transformed IAR-6–1 cells form E-cadherin-based AJs with underlying normal IAR-2 cells. E-cadherin accumulates in dot-like adhesions at the leading edge and in prominent AJs encircling the IAR-6–1 cell. Right - boxed region is enlarged. (C) Transformed IAR-6–1 epithelial cells migrate over the monolayer of normal IAR-2 epithelial cells. IAR-6–1 cells express GFP, IAR-2 cells express mKate2. Selected frames from a live imaging sequence. A corresponding track of the migrating IAR-6–1 cell is shown on Frame 4. (D). Transformed IAR-6–1 cells invade the monolayer of normal IAR-2 cells. IAR-6–1 cells express GFP, IAR-2 cells express mKate2. Frames from a live imaging sequence, substrate level. Frame 1 is a DIC image of the corresponding field taken at t = 0′, with the overlaid track of the migrating IAR-6–1 cell. The IAR-6–1 cell is on top of the monolayer at 145′; a pseudopod invades the monolayer and spreads at 180′; the entire cell migrates across the monolayer and spreads on the underlying substrate at 185′, and the cell acquires an elongated shape and migrates underneath the monolayer up until 465′. © PLoS One. Reproduced by permission of Natalya Gloushankova. Permission to reuse must be obtained from the rightsholder.129

