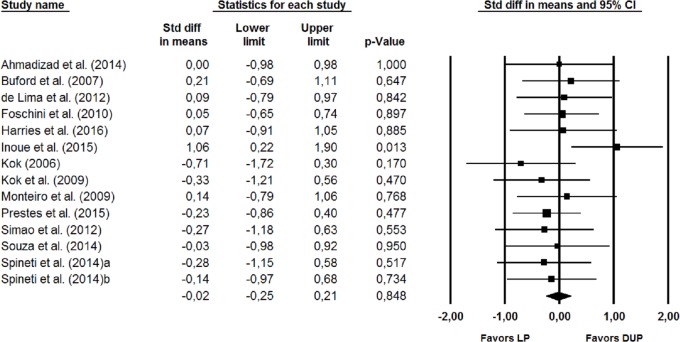
Figure 2. Forest plot showing differences between the effects plot of LP and DUP periodization models on measures of muscle hypertrophy.
The size of the plotted squares reflects the relative statistical weight of each study. The numbers on the X-axis denote the standardized mean differences expressed as Cohen’s d. The horizontal lines denote 95% confidence intervals (CI) for the standardized mean differences. DUP, daily undulating periodization; LP, linear periodization; Std diff, standardized difference.

