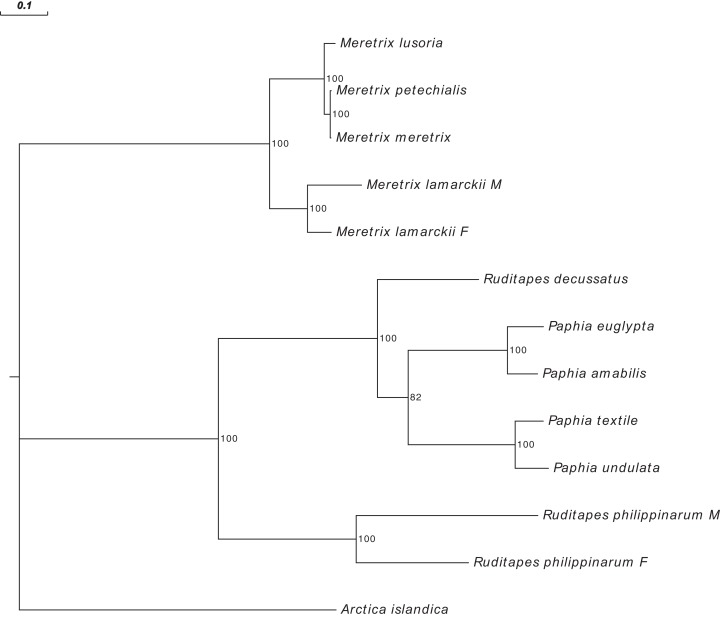
Figure 4. Maximum Likelihood (ML) tree of Veneridae obtained with all mitochondrial coding genes.
ML tree obtained with the MitoPhast pipeline; the complete input and output of this analysis is available on figshare (https://doi.org/10.6084/m9.figshare.4970762.v1).

