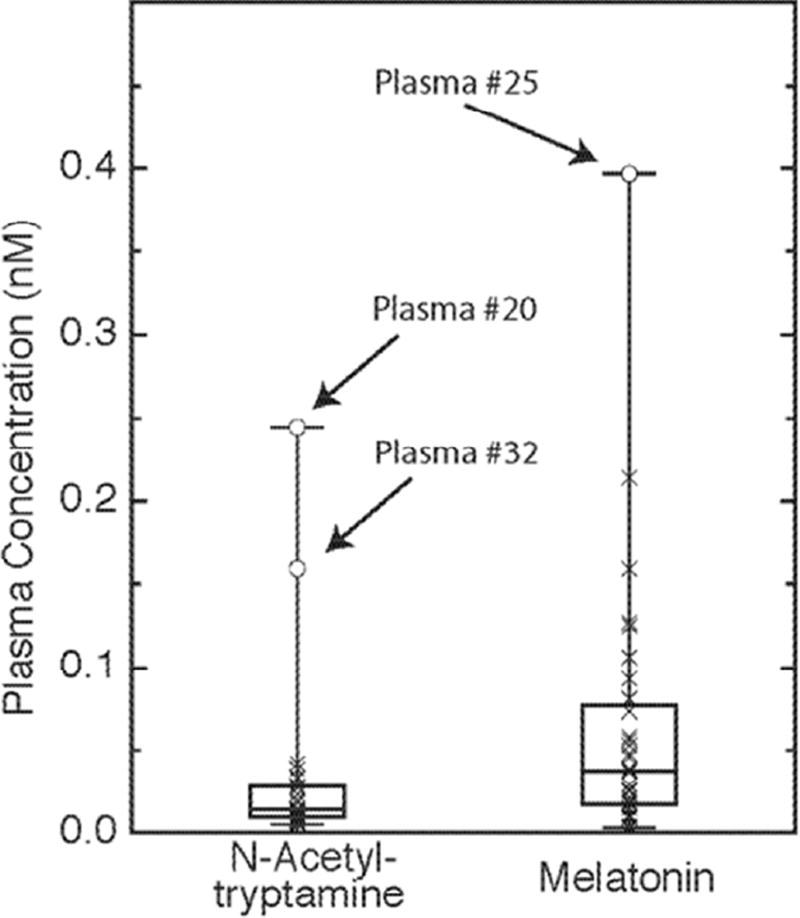
Figure 3. Human plasma N-acetyltryptamine and melatonin.
Box plot of daytime plasma N-acetyltryptamine and melatonin values in 32 healthy donors (22 to 69 years of age; 24 males and 8 females). Samples were collected between 07:30 and 14:00 h. Outliers are indicated by subject identifying numbers. Table S1 provides subject details including age, sex, weight and genotype and plasma values for N-acetyltryptamine, melatonin, tryptophan and kynurenine. Further details appear in the Materials and Methods section.

