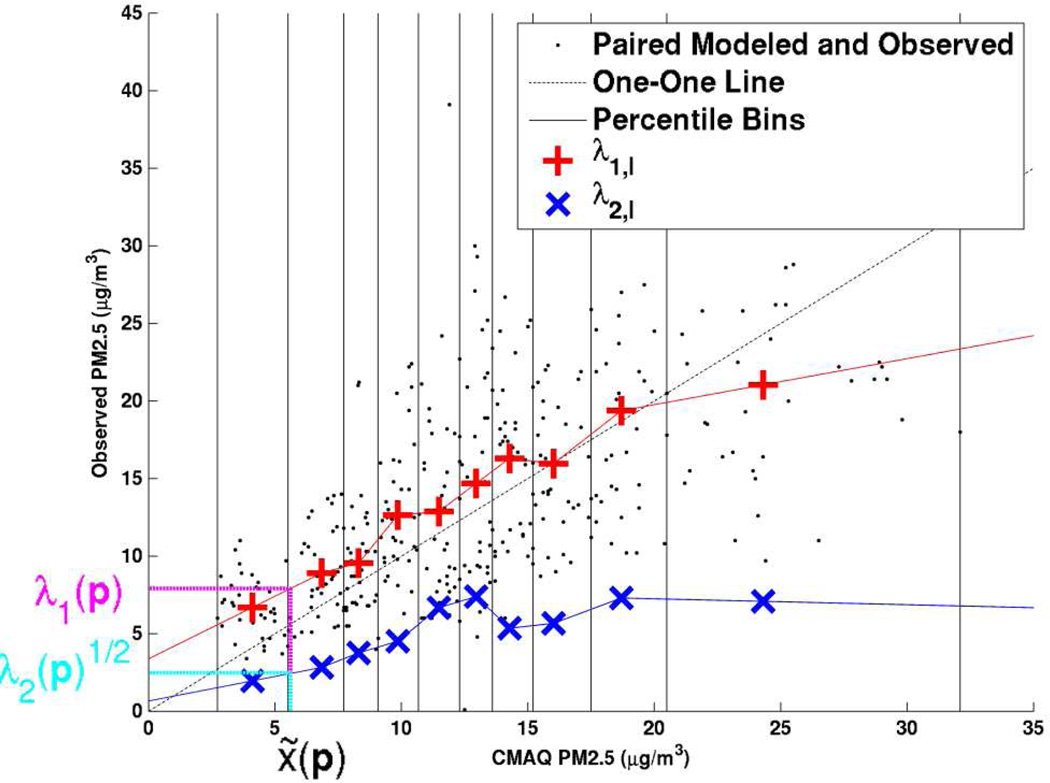
Figure 1.
RAMP analysis for an arbitrary CMAQ grid location on July 1, 2001 for daily PM2.5. The black dots are all the paired modeled and observed daily PM2.5 concentrations within a space/time region ℛ(p) consisting of the 3 closest stations to the CMAQ grid location of interest within 180 days of July 1, 2001, with modeled data on the independent axis and observed data on the dependent axis. The vertical black lines identify the 10 bins used to stratify all the paired data in which each bin contains one decile of all the paired points. The dotted black line is the one-to-one line between the modeled and observed data. The red + marker in each bin denotes λ1,l (x̃l, ℛ(p)), the average of paired observed values within the l-th decile bin. The blue × marker in each bin denotes the square root of λ2,l (x̃l; ℛ(p)), the standard deviation of paired observed values within that bin. As shown in the figure, the + and × markers are linearly interpolated to obtain the λ1 (p) and values, respectively, corresponding to the CMAQ modeled data x̃(p) within ℛ(p).

