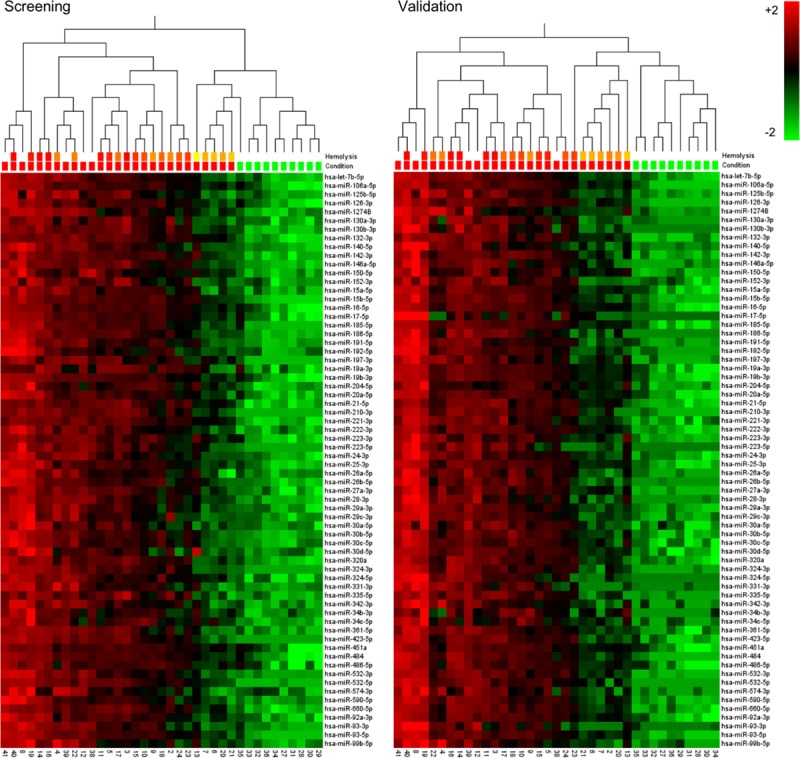
Figure 2.

One-way hierachically clustered relative differences of non-normalized Cq values of microRNAs, which differ in cerebrospinal fluid between subarachnoid hemorrhage (SAH; red) and neurologically healthy patients (green) in both the screening (P<0.001, q<0.002) and the validation study (P<0.001, q<0.0009). Downregulation shown in green and upregulation in red. The line “Hemolysis” indicates the degree of hemolysis as measured by the net absorbance of oxyhemoglobin and colored from red (high) to yellow (low); the white color represents a value that is either out of range on the spectrophotometer (SAH) or not available (Healthy).
