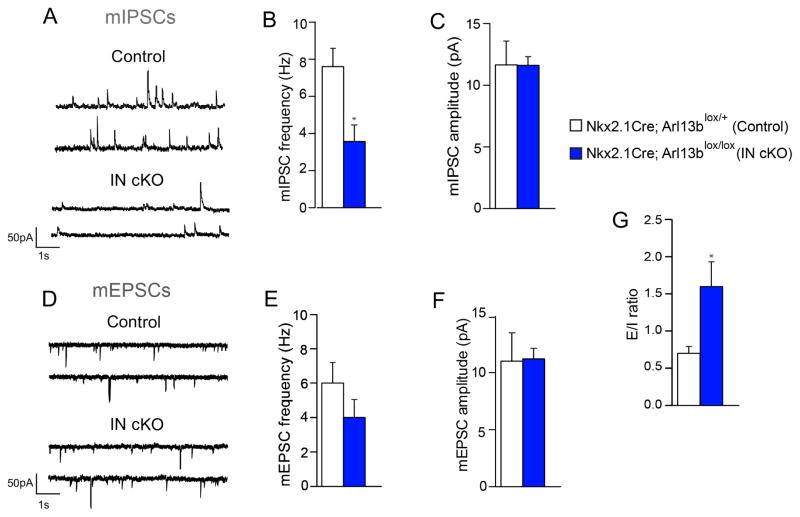
Figure 3. The functional impact of impaired primary cilia signaling in interneurons.
(A) Representative patch-clamp electrophysiological recordings showing mIPSCs in striatal MSNs of Nkx2.1Cre; Arl13blox/+ (control) and Nkx2.1Cre; Arl13blox/lox (IN cKO) mice. (B, C) Quantification of mIPSC frequency (B) and amplitude (C). *P<0.05 (Student’s t-test, mIPSC frequency: t(15) = 3.167, p = 0.0066; control, n=6; IN cKO, n =11). (D) Representative recordings showing mEPSCs in striatal MSNs of Nkx2.1Cre; Arl13blox/+ and Nkx2.1Cre; Arl13blox/lox brains. (E, F) Quantification of mEPSC frequency (E) and amplitude (F). Data shown are mean ± SEM. (Student’s t-test; mIPSC amplitude, mEPSC frequency, mEPSC amplitude: t-values <1). (G) Overall excitatory/inhibitory ratio in striatal MSNs of Nkx2.1Cre; Arl13blox/+ and Nkx2.1Cre; Arl13blox/lox brains (Student’s t-test: t(14)=2.277; p = 0.0390; control, n=6; IN cKO, n=10).

