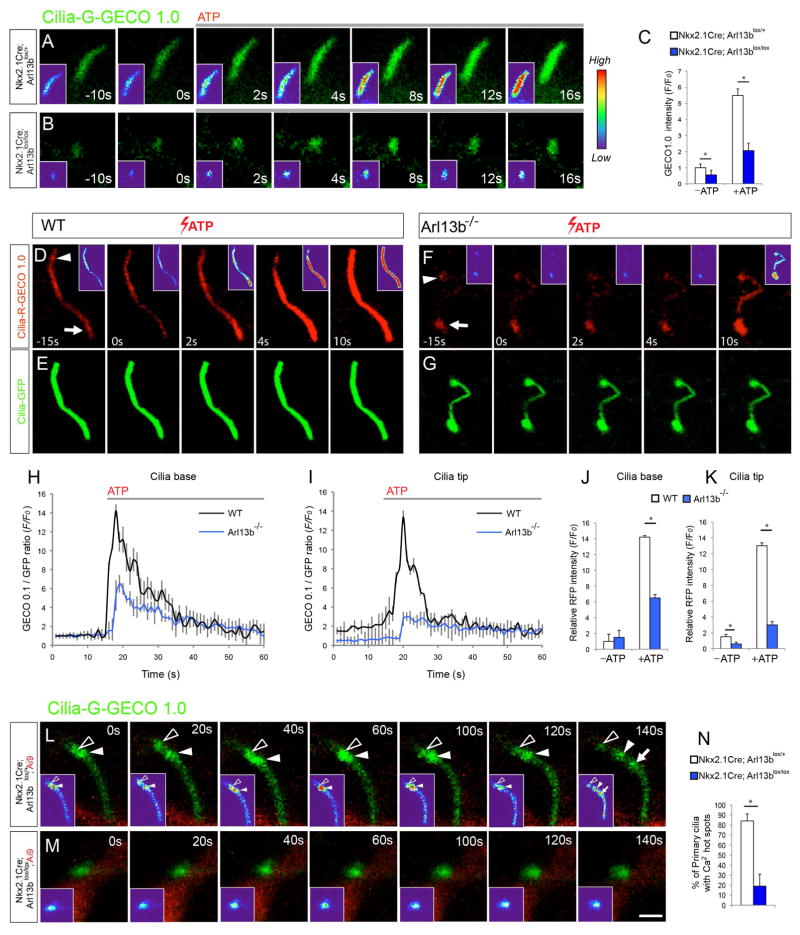
Figure 4. Defective calcium signaling in Arl13b deficient primary cilia.
(A–B) Time-lapse imaging of interneurons from Nkx2.1Cre; Arl13blox/+ (A) and Nkx2.1Cre; Arl13blox/lox (B) striatum expressing Cilia-G-GECO1.0. were treated with 10μM ATP. Insets (A–B) show changes in fluorescence intensity in pseudocolor (Red [High], Blue [Low]). (C) Quantification of changes in the fluorescence intensity of Cilia-G-GECO1.0 in control and mutant cilia. Data shown are mean ± SEM. *P<0.05 (Student’s t-test, p[−ATP] = 0.002, p[+ATP] = 0.0004). 15 neurons from 3 independent experiments were analyzed per group. (D–G) Time-lapse imaging of wild type (D, E) and Arl13b null (F, G) MEF cells expressing Cilia-R-GECO1.0 and Cilia-GFP treated with 10μM ATP. Arrowhead and arrow (D, F) indicate cilia tip and base, respectively. Insets (D, F) show fluorescence intensity in pseudocolor. (H, I) RFP fluorescence/GFP fluorescence ratio at cilia base (H) and tip (I) before and after administration of ATP in wild type (n=9) and Arl13b null cells (n=11). Data shown are mean ± SEM. *P<0.05 (Student’s t-test, p = 0.002). (J, K) Changes in calcium indicator (GECO-RFP)/GFP fluorescence intensity at cilia base (Arrow [D, K]; J) and tip (Arrowhead [D, F]; K) before (−ATP, T=0) and after ATP (+ATP) in wild type (n=9) and Arl13b null cilia (n=11). Data shown are mean ± SEM. *P<0.05 (Student’s t-test, p[J] = 0.0006, p[K] = 0.0002). (L–M) Time-lapse imaging of spontaneous calcium dynamics in interneuronal primary cilia from Nkx2.1Cre; Arl13blox/+; Ai9 (L) and Nkx2.1Cre; Arl13blox/lox; Ai9 (M) striatum. Arrowheads and arrow point to dynamic calcium hot spots in control cilia. Such hot spots are comparatively rare in Arl13b deficient cilia (N). Data shown are mean ± SEM. *P<0.05 (Student’s t-test, p[N] = 0.0005). Scale bar, 2μm (A, B, L, M); 1.4μm (D–G). See also Figure S4.

