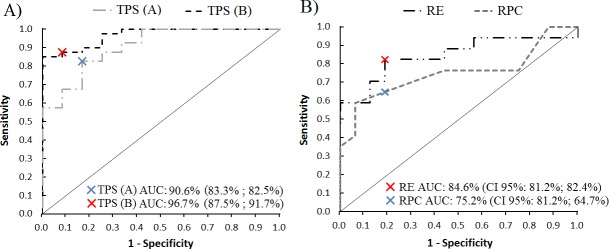
Fig 3.
3A, ROC curves for rest total power spectra (TPS A) and postural total power spectra (TPS B) comparing tremulous and healthy subjects. 3B, ROC curves for relative energy feature (RE) and Relative Power Contribution to the first harmonic feature (RPC). Blue and red crosses mark the highest discriminative threshold for each ROC curve. AUC, area under the curve. CI, confidence interval, followed by sensitivity and specificity for the given value.

