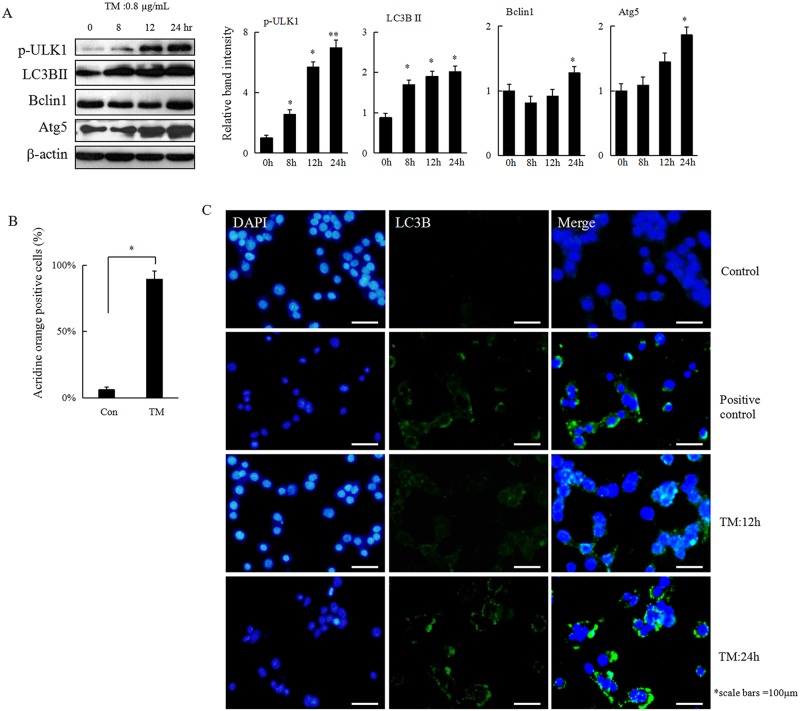
Fig 2. Autophagy is induced in response to ER stress in HCC cells.
(A) Heap 1–6 cells were treated with TM (0.8 μg/mL) for 0, 8, 12, or 24 h. Cells were collected and subjected to western blot analyses with specific antibodies directed against p-ULK1, LC3B, Beclin1, Atg5, or β-actin. The density of the corresponding bands was measured quantitatively with an aforementioned method. Each data point is the mean ± SD of 3 independent experiments, *P<0.05 or **P<0.01 denotes a significant difference compared with normal control Hepa 1–6 cells. (B) Hepa1-6 cells were treated with TM (0.8 μg/mL) for 24 h and stained with acridine orange (1 mg/mL) for 15 min, followed immediately by detection using flow cytometry. The values were expressed as mean ± SD of 3 independent experiments, *P<0.05 denotes significant difference from normal control Hepa 1–6 cells. (C) Hepa 1–6 cells were treated with TM (0.8 μg/mL) for 12 h or 24 h and harvested for immunofluorescence assay and representative results are shown. Hepa 1–6 cells without or with strvation for 24 h were served as control or positive control, respectively.

