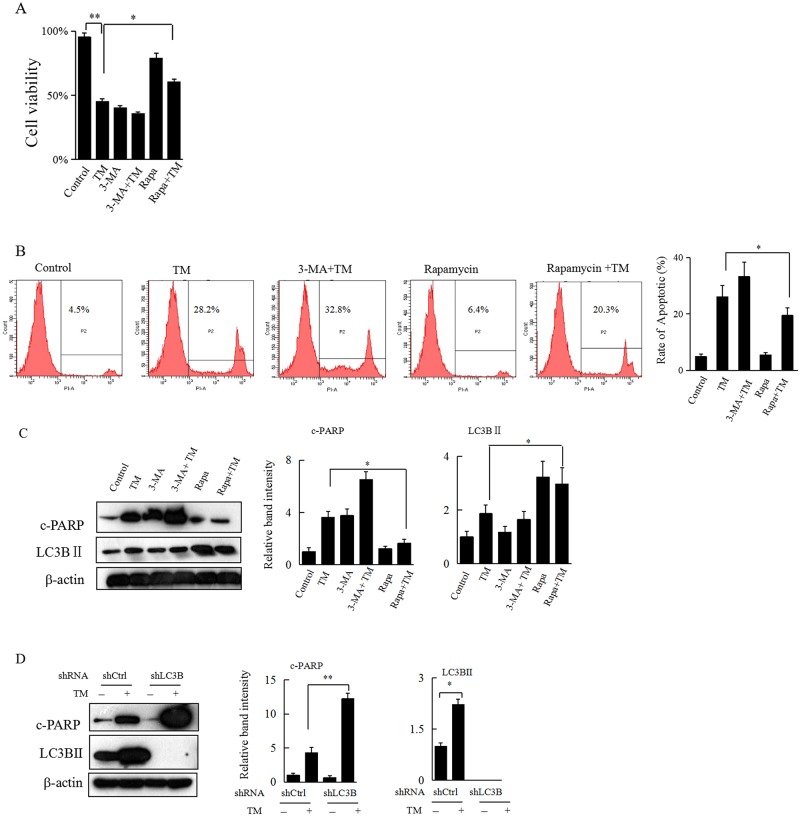
Fig 3. Inhibition of ER stress-induced autophagy aggravates, while activation of ER stress-induced autophagy decreases apoptosis in HCC cells.
(A) The Hepa 1–6 cells were incubated with rapamycin (100 nM) or 3-MA (5 mM) for 2 h, followed by treatment with TM (0.8 μg/mL) for an additional 24 h. Cells were then subjected to WST-1 assay. Data represent the mean ± SD of 3 separate experiments. *P<0.05 or **P<0.01 denotes a significant difference from the indicated control. (B) Hepa 1–6 cells that underwent the same treatment as in Figure 3A were subjected to flow cytometry assay and representative results are shown. The rate of apoptosis in each group was calculated based on PI staining assays. (C) Hepa 1–6 cells that underwent the same treatment as in Figure 3A were collected and subjected to western blot analyses with specific antibodies directed against c-PARP, LC3B, or β-actin. The density of the corresponding bands was measured quantitatively with an aforementioned method. Each data point is the mean ± SD of 3 independent experiments, *P<0.05 or **P<0.01 denotes a significant difference from the indicated control. (D) Hepa 1–6 cells with or without specific knockdown of LC3B were treated with TM (0.8 μg/mL) for 24 h and then harvested for western blot analyses with specific antibodies directed against c-PARP, LC3B II, or β-actin.The density of the corresponding bands was measured quantitatively with an aforementioned method. *P<0.05 or **P<0.01 denotes a significant difference from the indicated control.

