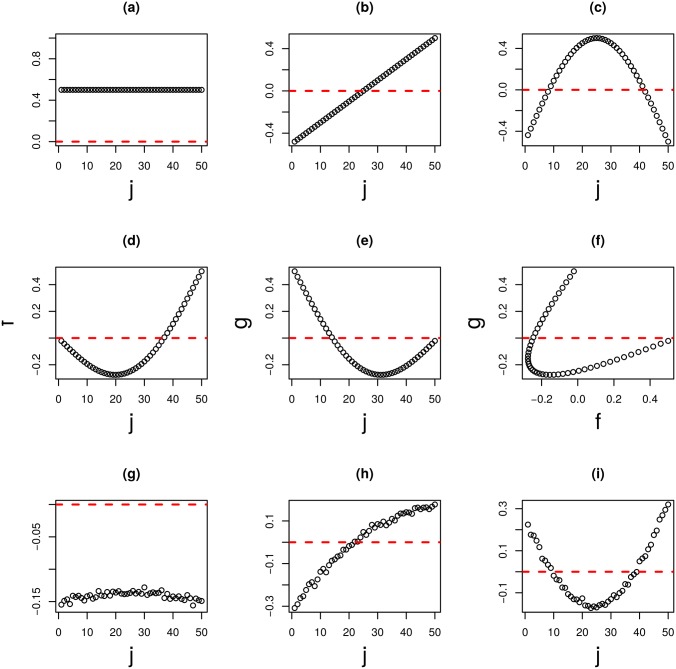
Fig 4. The results of TD applied to the type I tensor generated from a synthetic dataset (M = 50).
(a) to (c) are orthogonal base functions: (a) constant, (b) linear, (c) half period sinusoidal. (d) and (e) base functions used for generating . (d) k = 1, (e) k = 2. (f) is the scatter plot of (d) and (e). (g) to (i) are the first, second, and third sample singular value vectors xℓ3,j and ℓ3 = 1, 2, 3, and are computed by applying TD to synthetic data.

