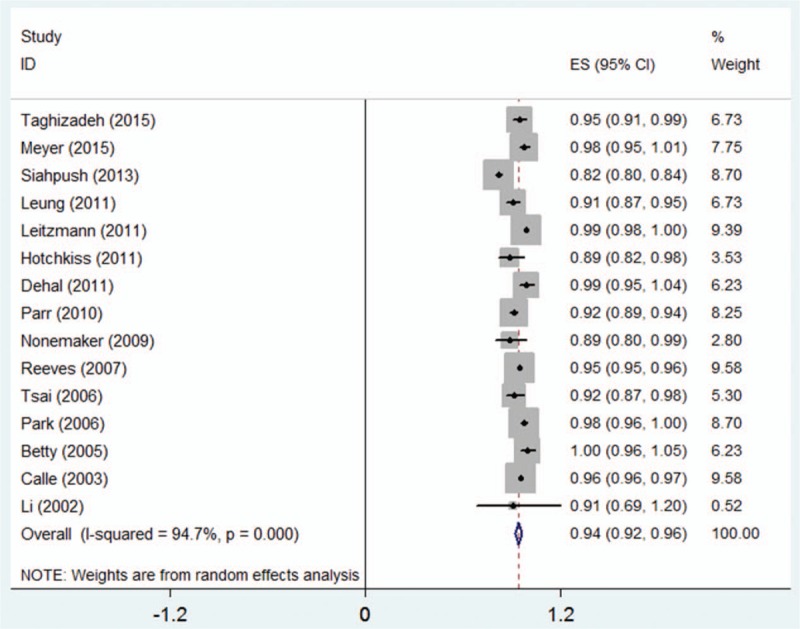
Figure 2.

Two-stage dose–response meta-analysis on BMI and the risk of mortality from LC. The squares represent the relative risk (RR) per 5 kg/m2 increase for each individual study, with the area reflecting the weight assigned to the study. The horizontal line across each square represents the 95% confidence interval. The diamond represents the summary RR per 5 kg/m2 in BMI, with width representing 95% confidence interval. BMI = body mass index, LC = lung cancer.
