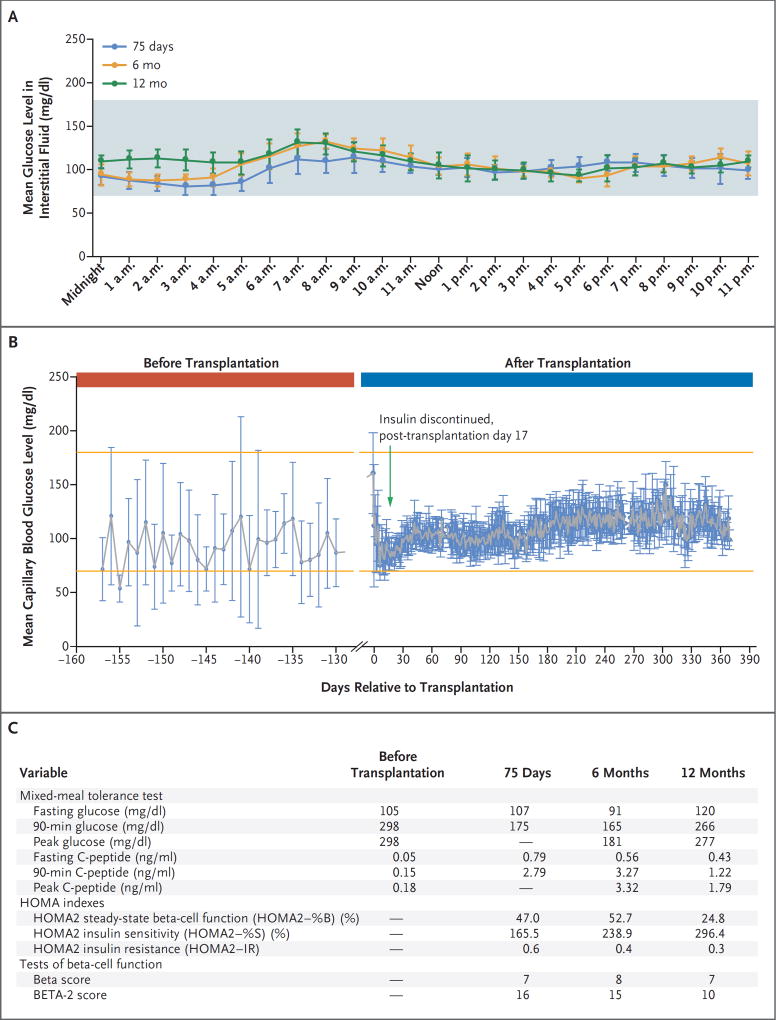
Figure 1. Results of Glucose Monitoring and Mixed-Meal Tolerance Tests, Homeostasis Model Assessment (HOMA2) Index Values, and Beta and BETA-2 Scores in the Patient.
Panel A shows the results of hourly continuous glucose monitoring (G4 Platinum, Dexcom) on the 7 days before each study visit. I bars indicate standard deviations. The shaded area shows the glucose range of 70 to 180 mg per deciliter (3.9 to 10.0 mmol per liter). The 7-day mean (±SD) glucose level in 1986 interstitial glucose measurements obtained every 5 minutes was 99±15 mg per deciliter (range, 60 to 169) (5.5±0.8 mmol per liter [range, 3.3 to 9.4]) at 75 days; in 1985 interstitial glucose measurements, it was 105±17 mg per deciliter (range, 71 to 158) (5.8±0.9 mmol per liter [range, 3.9 to 8.8]) at 6 months; and in 1966 interstitial glucose measurements, it was 109±15 mg per deciliter (range, 73 to 151) (6.0±0.8 mmol per liter [range, 4.1 to 8.4]) at 12 months. To convert the values for glucose to millimoles per liter, multiply by 0.05551. Panel B shows 2012 capillary blood glucose values obtained before transplantation and through postoperative day 365. I bars indicate standard deviations. The upper and lower orange lines show the glucose range of 70 to 180 mg per deciliter. Panel C shows variables derived from the mixed-meal tolerance test and HOMA2 indexes. Samples obtained in the mixed-meal tolerance test at 75 days for measurements of glucose and C-peptide levels included only 0 and 90 minutes. The HOMA2 estimates steady-state beta-cell function (HOMA2–%B) and insulin sensitivity (HOMA2– %S) as percentages of a normal reference population. HOMA2–IR is the reciprocal of HOMA2–%S. HOMA2 indexes were calculated with the use of the HOMA2 calculator, version 2.2.3 (Diabetes Trials Unit, University of Oxford), available at www.dtu.ox.ac.uk/homacalculator. Beta scores range from 0 to 8, with higher scores indicating better islet function, and BETA-2 scores range from 0 to 42, with lower scores indicating higher risks of glucose intolerance and insulin dependence. To convert the values for C-peptide to nanomoles per liter, multiply by 0.331.

