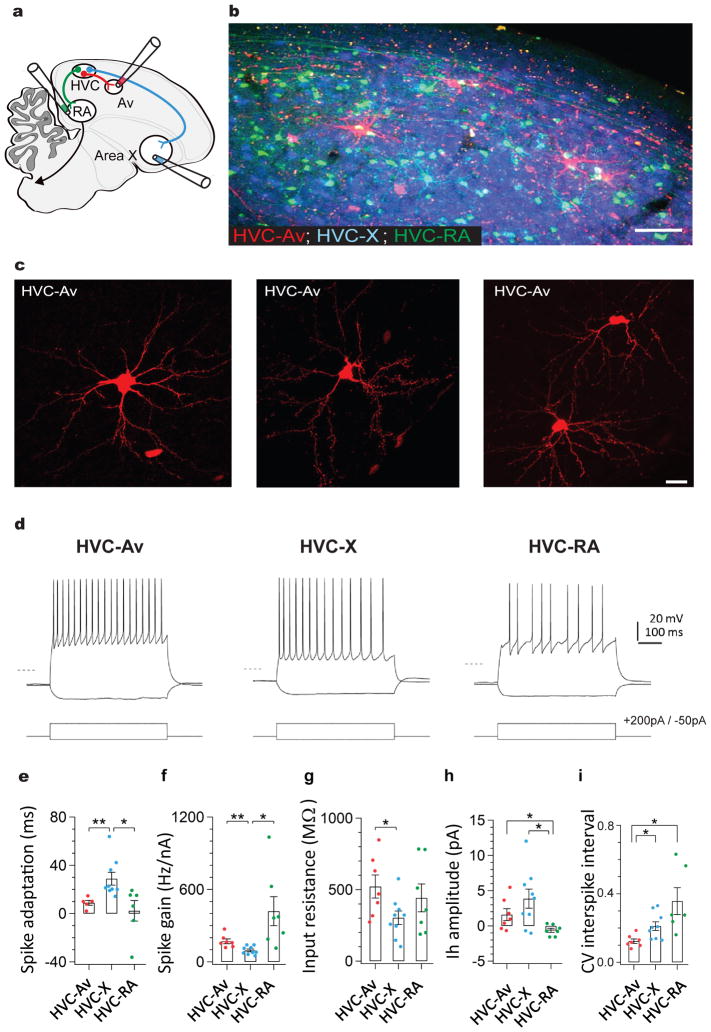
Figure 1. A distinct class of projection neurons links the song premotor nucleus HVC to the auditory region Avalanche.
a) Schematic showing the design of retrograde labeling experiments. Different fluorescent retrograde tracers were injected into Av (dextran, Alexa Fluor 594), RA (dextran, Alexa Fluor 488), and Area X (fast blue). b) Parasagittal section through retrogradely labeled HVC (left panel) reveals that neurons projecting into Avalanche (red) are distinct from neurons projecting to Area X (blue) or RA (green). Inset shows magnified image outlined by white box. c) Images of individual HVCAv neurons retrogradely labeled by AAV2/9 GFP injection into Av. d) Visualized whole-cell current clamp recordings from retrogradely-labeled HVC projection neurons in brain slices in response to 500ms current injection (−50 and +200 pA; dashed line = −80mV). HVCAv neurons differ from HVCX neurons in their intrinsic properties, including their e) spike adaptation rate (two-sample t(10) = 3.5, P = 0.005 for HVCAv neurons (n = 5) versus HVCX neurons (n = 9); two-sample t(9) = 2.6, P = 0.02 for HVCX neurons (n = 9) versus HVCRA neurons (n = 6)), f) spike gain (two-sample t(10) = 3.3, P = 0.007 for HVCAv neurons (n = 7) versus HVCX neurons (n = 9); two-sample t(6) = 2.7, P = 0.03 for HVCX neurons (n = 9) versus HVCRA neurons (n = 7)), g) input resistance (two-sample t(10) = 2.3, P = 0.04 for HVCAv neurons (n = 7) versus HVCX neurons (n = 9)). h) HVCAv neurons differ from HVCRA neurons in their Ih amplitude (two-sample t(7) = 2.5, P = 0.04 for HVCAv neurons (n = 7) versus HVCRA neurons (n = 7); two-sample t(9) = 3.2, P = 0.01 for HVCX neurons (n = 9) versus HVCRA neurons (n = 7)). HVCAv neurons differ from HVCX and HVCRA neurons in i) the coefficient of variation of their DC-evoked interspike intervals (two-sample t(5) = 2.9, P = 0.03 for HVCAv neurons (n = 7) and HVCRA neurons (n = 6); two-sample t(12) = 3.0, P = 0.01 for HVCAv neurons (n = 7) and HVCX neurons (n = 9)). Scale bar, 100μm in B (left panel) and 15μm in B (right panel). Scale bar, 100μm in B and 15μm in C.

