FIGURE 1.

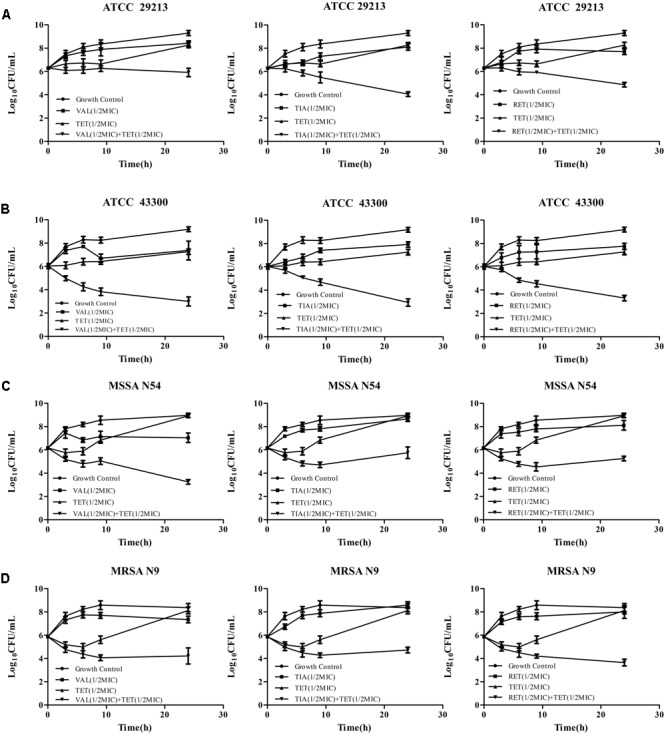
Time-kill curves of VAL, TIA, RET, and TET alone and in combinations against ATCC 29213 (A), ATCC 43300 (B), MSSA N54 (C), and MRSA N9 (D). Results show the mean ± standard error from three independent experiments.

Time-kill curves of VAL, TIA, RET, and TET alone and in combinations against ATCC 29213 (A), ATCC 43300 (B), MSSA N54 (C), and MRSA N9 (D). Results show the mean ± standard error from three independent experiments.