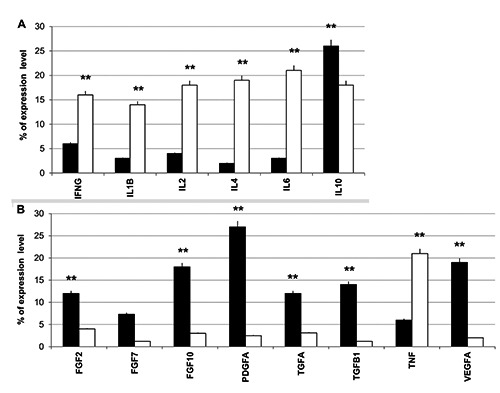
Figure 6.

Real-time PCR array analysis: A) inflammatory cytokines; B) growth factors. The results are reported as % of expression level of each target gene in post-treatment samples compared to pre-treatment samples in both Sham Group (white bars) and Active Group (black bars). A t-test was used to determine significant differences (P<0.05): *P<0.05 and **P<0.01.
