
Fig. 6.
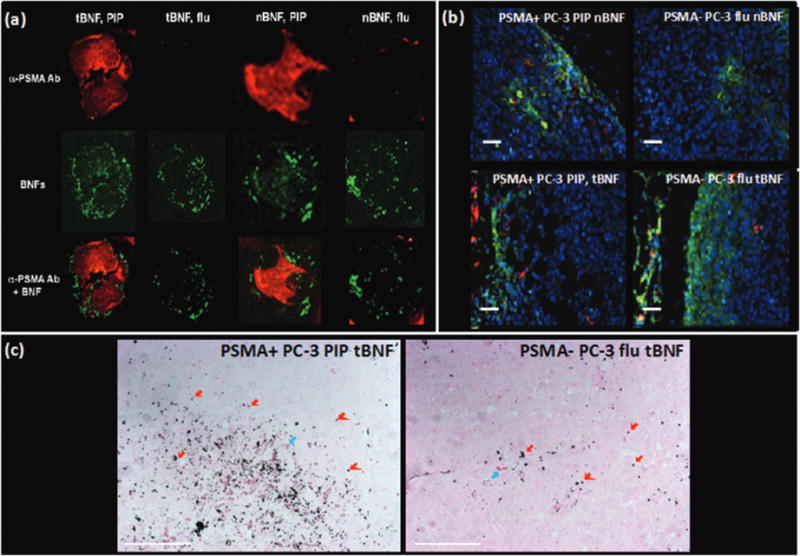
(a) Ex vivo optical images of excised PSMA+ PC3 PIP and PSMA− PC3 flu tumors showing uptake of targeted (tBNF; 5) and non-targeted (nBNF, 4) BNF nanoparticles (green) as well as the PSMA expression (red) by the PSMA+ PC3 PIP and PSMA− PC3 flu tumors; (b) ex vivo epifluorescence microscopy of excised PSMA+ PIP and PSMA− flu tumors showing uptake of targeted (tBNF; 5) and non-targeted (nBNF; 4) nanoparticles (red) in PSMA+ PC3 PIP and PSMA− PC3 flu tumors; blue (nuclei), green (macrophages); (c) Prussian blue staining of excised PSMA+ PC3 PIP and PSMA− PC3 flu tumors showing higher uptake of the targeted BNF nanoparticles (dark blue colored punctate signals; red arrows) by PSMA+ PC3 PIP cells versus the PSMA− PC3 flu tumor cells; blue arrows (red blood cells); pink (PSMA expression); scale bars = 50 μm.