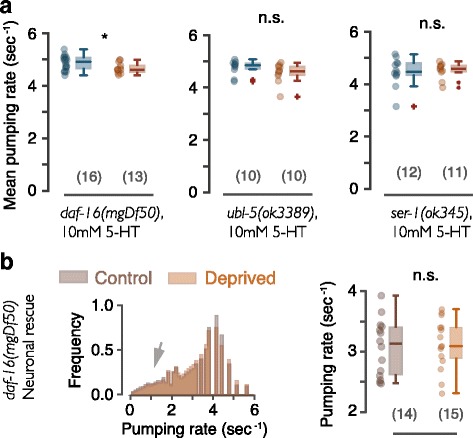
Fig. 5.

A neuronal deficiency underlies the post-deprivation slowdown of feeding. a Box plots of pumping rates for 5-HT-triggered pumping in undisrupted and deprived daf-16(mgDf50), ubl-5, and ser-1 mutants. b Left: distributions of pumping rates for deprived and control daf-16 mutants where neuronal function of DAF-16 was restored. Arrow points to the indistinguishable left tails of the distributions, indicating similar statistics of sporadic pumping. Right: mean pumping rates under these conditions. Horizontal lines, boxes, and bars depict medians, 1st and 3rd quartiles, and 5th and 95th percentiles, respectively. Sample sizes are noted in parentheses; asterisks and double asterisks denote significant differences (p < 0.05 and p < 0.01, respectively)
