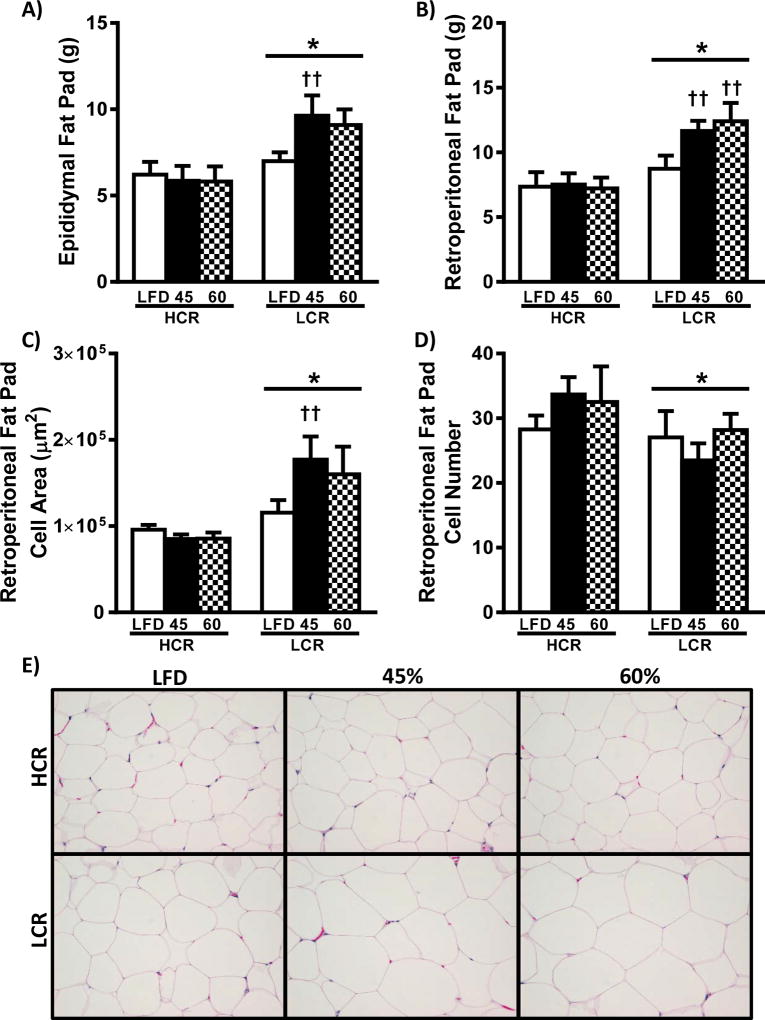
Figure 4.
White adipose tissue. Epididymal (A) and retroperitoneal (B) fat pad masses at the time of sacrifice. Morphometric analysis of the retroperitoneal fat pad are presented as (C) cell area and (D) cell number are presented as means ± SEM (n=8). (E) Representative H&E images of retroperitoneal fat pad. * p<0.05 main effect HCR vs. LCR, †† p<0.05 LFD vs. HFD within strain.

