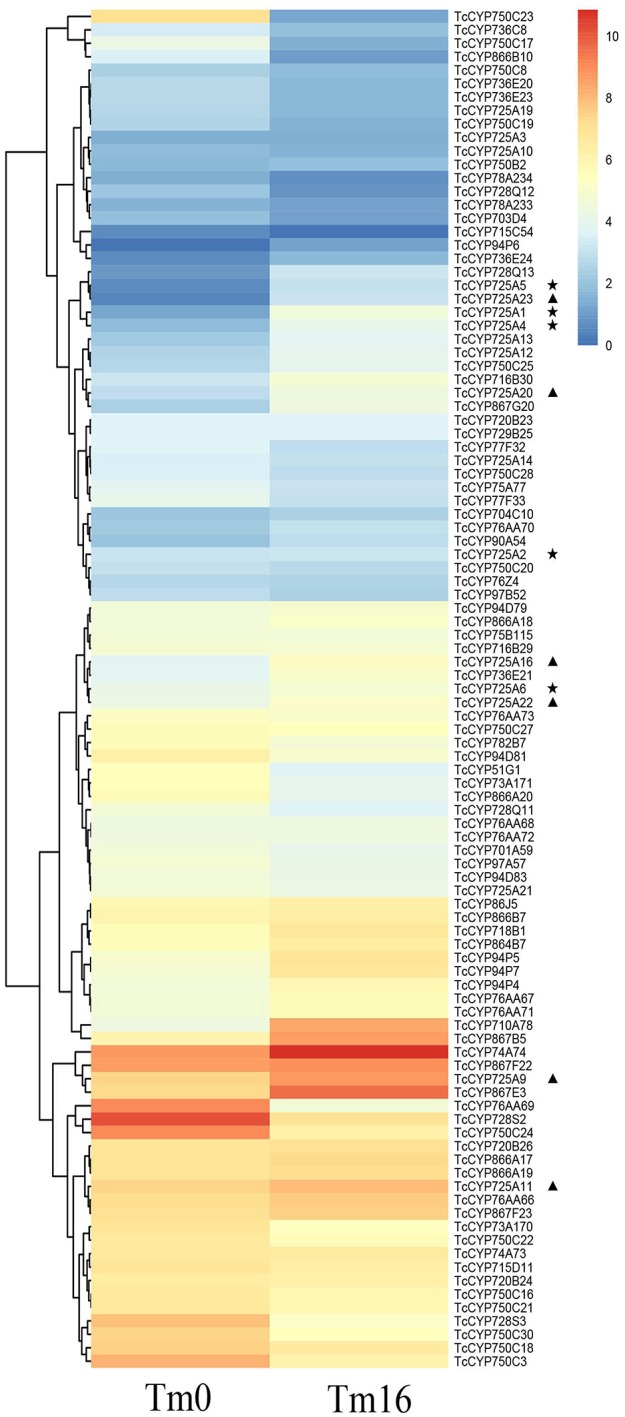
Figure 5.

Expression pattern of T. chinensis CYP450s under MeJA elicitationin according to the analysis of RNA-Seq dataset. The color scale shows the expression quantity (red, high expression; blue, low expression). Heat map was created using HemI. Heatmap Illustrator v1.0. “⋆” indicates the known taxoid hydroxylase genes, and “▴” indicates the candidate genes.
