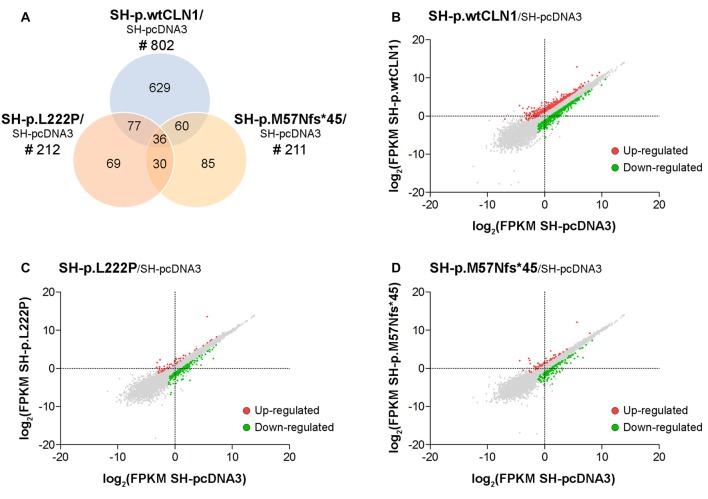
Figure 2.
Transcriptomic analysis of CLN1 transfected cell lines. (A) Venn diagram demonstrating the amount of differentially expressed genes, identified in SH-p.wtCLN1 cells (n = 802) and in the two mutated CLN1-transfected cell lines (n = 212, SH-p.L222P and n = 211, SH-p.M57Nfs*45). Notably, 629 differentially expressed genes (DEGs) were exclusively expressed in the SH-p.wtCLN1 clone. Differential gene expression analysis was performed on RA-NBM differentiated cell lines and compared to the empty vector expressing cells (SH-pcDNA3), analyzed under the same culture conditions. (B–D) Scatter plot representation of differentially expressed genes identified in differentiated SH-p.wtCLN1 (B), SH-p.L222P (C) and SH-p.M57Nfs*45 (D) cells. Gene expression levels are reported as log2(FPKM) (y axis) and compared to differentiated SH-pcDNA3 cells (x axis). Colored dots represent differentially expressed genes (thresholds: |log2FC| > 1 and q-value < 0.05), which are either up-regulated (red dots) or down-regulated (green dots).

