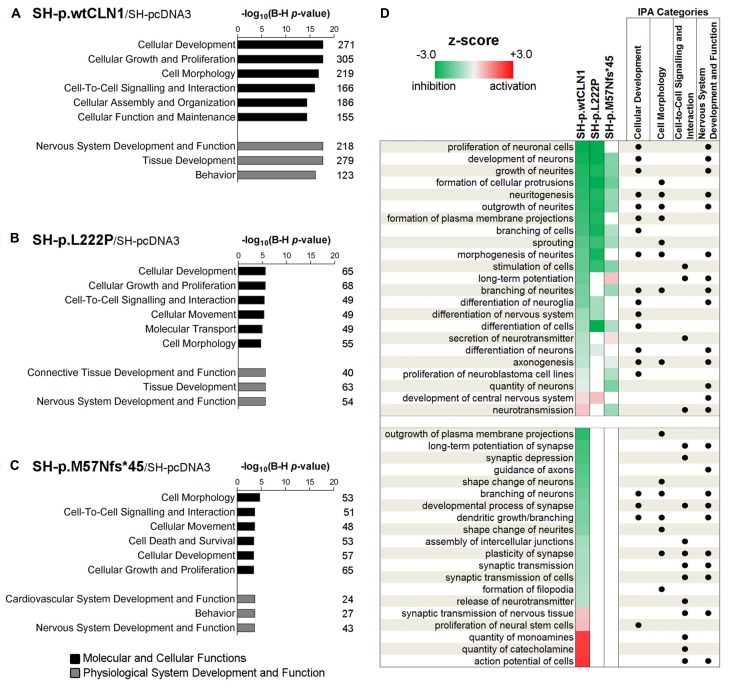
Figure 3.
Bioinformatic survey of identified differentially expressed genes in wild-type and mutated CLN1 cell lines. (A–C) Categorization by Ingenuity Pathway Analysis (IPA, Qiagen) of DEGs in differentiated SH-SY5Y cells. Molecular and Cellular Functions as well as Physiological System Development and Functions IPA classes were examined. Categories of Cellular Development, Cell-to-Cell Signalling and Interaction, Cell Morphology as well as Nervous System Development and Function with lowest B-H corrected p-values were further scrutinized. The number of genes assigned to each category is reported. Statistical significance is reported as –log10 of Benjamini-Hochberg corrected p-value. (D) Heat-map representation depicted most meaningful IPA functional annotations enclosed in Cellular Development, Cell-to-Cell Signalling and Interaction, Cell Morphology and Nervous System Development and Function. Cellular functions correlating with morphological changes of neuronal cells (neuritogenesis, growth/branching/ morphogenesis of neurites and axonogenesis) and neuronal commitment (differentiation of neurons, development of neurons) were commonly affected in SH-p.wtCLN1 and, to a lesser extent, in the two mutated cell lines, following a gradient according to z-scores (from highest to lowest). Functions related to neuronal transmission (long-term potentiation, secretion of neurotransmitter and neurotransmission) were also annotated. Notably, other annotations related to sprouting of neuronal processes (dendritic growth/branching, shape change of neurites, shape change/branching of neurons, guidance of axons) as well as synaptic transmission (developmental process of synapse, long-term potentiation of synapse, plasticity of synapse, release of neurotransmitter and action potential of cells) were selectively assigned to SH-p.wtCLN1 cells only. Functional annotations, shared among the IPA classes are marked by dots. Colored squares represent either a predicted activation (red) or a predicted inhibition (green) according to z-score calculated by IPA algorithm; higher color intensity correlates with more significant bioinformatic prediction.

