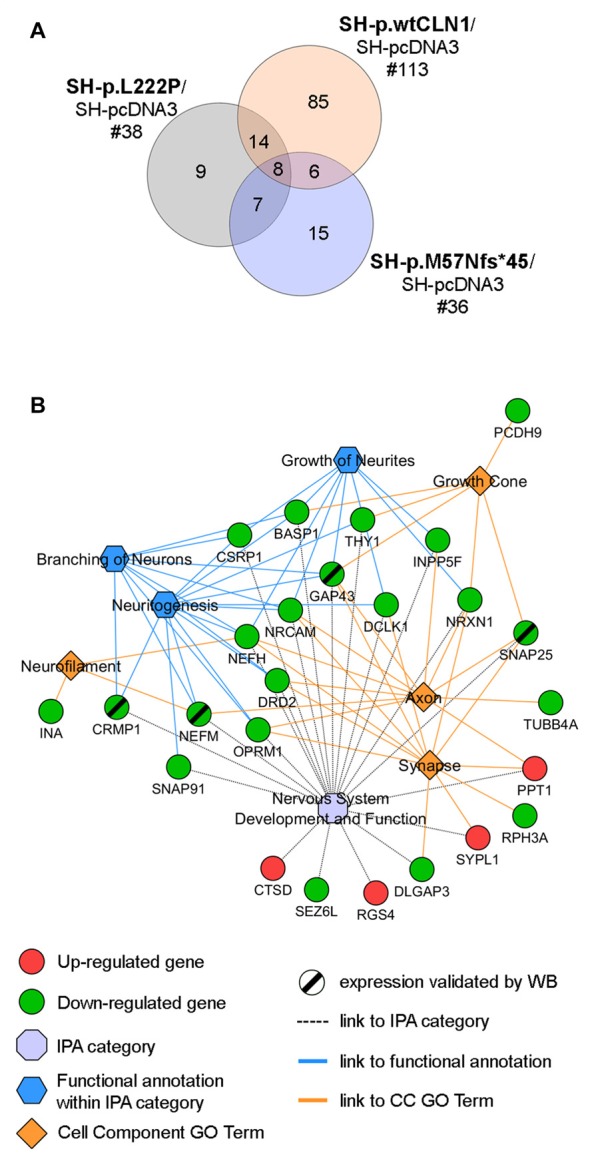
Figure 4.

Palmitoylation gene/protein survey. (A) Venn diagram of identified palmitoylated gene products (palmitoylated proteins) among differentially expressed genes in the transcriptomic profiles of SH-p.wtCLN1, SH-p.L222P and SH-p.M57Nfs*45, compared to an empty-vector (SH-pcDNA3) expressing cells. The amount of identified DEGs is stated below the cell line name, whereas the numbers of genes shared among the three comparisons are reported in the intersections of the Venn diagram. Eighty-five of such genes were selectively expressed in SH-p.wtCLN1 only. See Supplementary Tables S4, S5, S6 for the compendium of genes of each CLN1 cell line and Supplementary Figure S4 for genes assigned to each interaction area of Venn diagram. (B) Twenty five genes, specifically expressed in SH-p.wtCLN1 cells, were connected to Nervous System Development and Function as well as to annotations related to neurites formations. Cell Component GO terms (PANTHER) were also linked. Notably, CTSD, associated with CLN10 disease was found to be up-regulated in wild-type PPT1-overexpressing cells, further supporting a genetic interaction between these two neuronal ceroid lipofuscinoses (NCL) genes. For an exhaustive compendium of identified genes encoding the palmitoylated proteins and assigned IPA functions and GO terms see Table S7 in supplementary materials. Genes, marked by a black slash were further investigated for protein expression by Western Blotting (WB) analysis.
