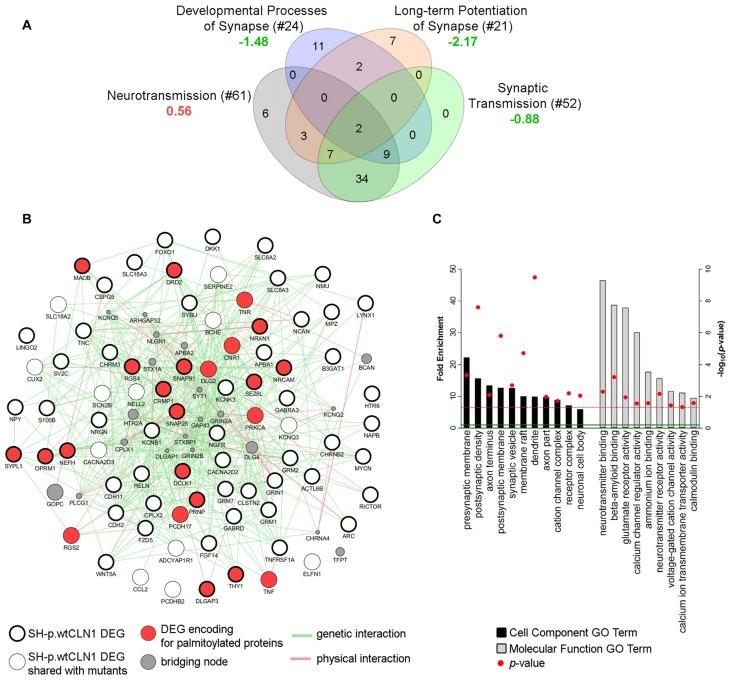
Figure 7.
Bioinformatic survey of DEGs assigned to the synaptic compartment. (A) Four IPA functional annotations of SH-p.wtCLN1 transcriptomic profile, and related to neuronal transmission were investigated. The number of DEGs assigned to each category is reported between brackets whereas the associated z-score is reported below (green = predicted inhibition; red = predicted activation). The four IPA attributes enclosed 81 unique DEGs, which served as input for further bioinformatic queries. (B) A functional network encompassing 81 DEGs drawn using GeneMANIA plugin in Cytoscape software. Both genetic and physical interactions were used to denote the bridging nodes. Thick borders pinpoint DEGs which were specifically expressed in SH-p.wtCLN1, and not shared with the other two mutants. Genes encoding for palmitoylated proteins are marked in red. GAP43 and BCAN nodes represent down-regulated genes of SH-p.wtCLN1 transcriptomic profile. GAP43 encodes for a membrane protein associated with a growth cone of neuronal cells (see discussion section for further information), whereas BCAN encodes brevican, a chondroitin sulfate proteoglycan highly expressed in the extracellular matrix of synaptic space (Blosa et al., 2015). (C) Statistical overrepresentation profile of 81 DEGs derived through PANTHER classification system linked them to synaptic compartments as well as axons (Cell Component GO terms categorization). Likewise, many genes were involved in membrane channel activity and regulation, as well as in neurotransmission and glutamate receptor activity (Molecular Function GO terms). Fold Enrichment (FE) score represents a portion of genes enclosed in a specific term. Enrichment above a score of 1 (marked by green line) indicates an overrepresentation. GO terms were grouped for related ontological classes and sorted hierarchically according to a decreasing FE score, starting from the most specific subclass towards less specific ones. Only the most specific categories for each class associated with a FE score greater than the expected value are shown. P-value was adjusted using Bonferroni correction for multiple testing and reported as −log10(p-value); red line represents a p-value equal to 0.05.

