FIGURE 2.

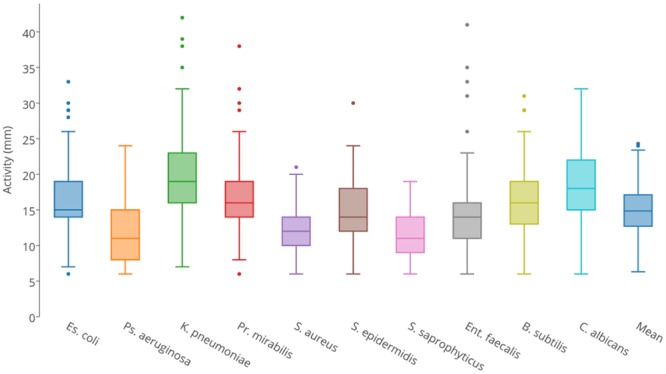
Box and whisker plots of isolates’ predatory activity (zone of killing diameter in mm) illustrating the variation in predatory activity exhibited by all isolates for each of the 10 prey organisms.

Box and whisker plots of isolates’ predatory activity (zone of killing diameter in mm) illustrating the variation in predatory activity exhibited by all isolates for each of the 10 prey organisms.