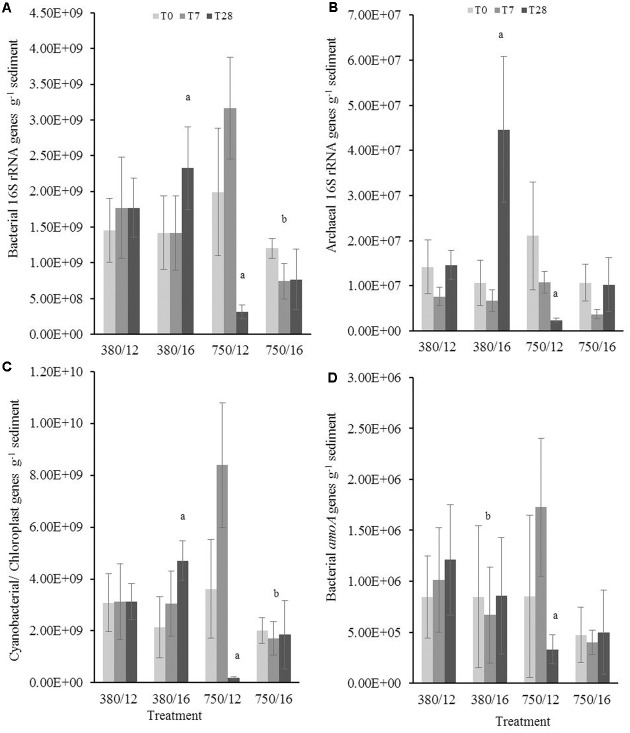
FIGURE 3.
The independent and interactive effects of CO2 and or temperature on the abundance (g-1 sediment) of (A) bacterial 16S rRNA, (B) archaeal 16S rRNA, (C) cyanobacterial/chloroplast 16S rRNA, and (D) bacterial amoA genes in the upper layer (0–0.5 cm) of muddy sediment. Four syringe cores were taken at each time point (T0, light gray; T7, dark gray; and T28, black) from each environmental treatment (x-axis). Significant effects from the model output are indicated by the letter a (where there is an interaction with day); b (interaction between elevated CO2 and elevated temperature). Error bars represent standard deviation of repeated measurements (n = 4) from treatment replicates (n = 3).

