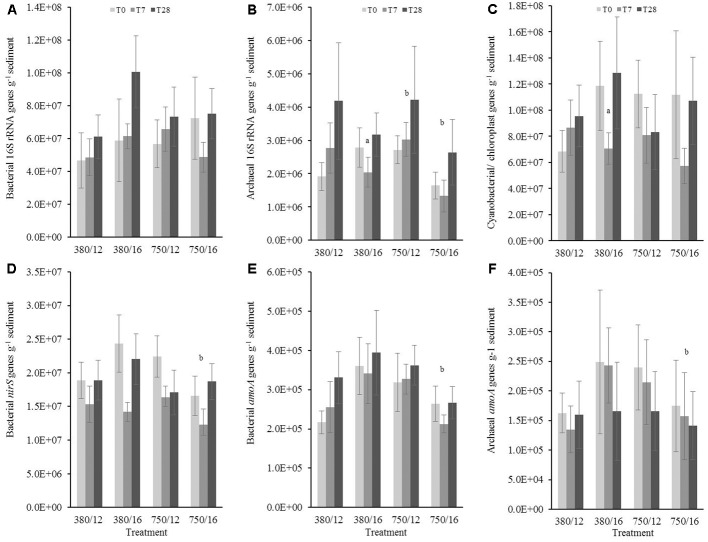
FIGURE 5.
The effects of CO2 and/or temperature on the abundance (g-1 sediment) of (A) bacterial 16S rRNA, (B) archaeal 16S rRNA, (C) cyanobacterial/chloroplast 16S rRNA, (D) bacterial nirS, (E) bacterial amoA genes, and (F) archaeal amoA genes in the top layer (0–1 cm) of sandy sediment. Four syringe cores were taken at each time point (T0, light gray; T7, dark gray; and T28, black) from each environmental treatment (x-axis). Significant effects from the model output are indicated by the letter a (where there is an interaction with day); b (interaction between elevated CO2 and elevated temperature). Error bars represent standard deviation of repeated measurements (n = 4) from treatment replicates (n = 3).

