Figure 2.

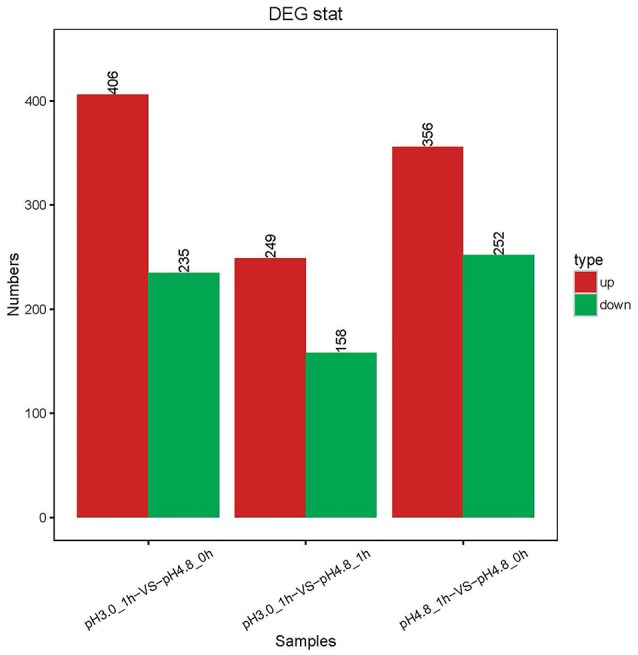
Changes in gene expression profile in the three comparisons. The red and green bars represent up- and down-regulated genes, respectively, and the numeric labels represent the number of genes in the group.

Changes in gene expression profile in the three comparisons. The red and green bars represent up- and down-regulated genes, respectively, and the numeric labels represent the number of genes in the group.