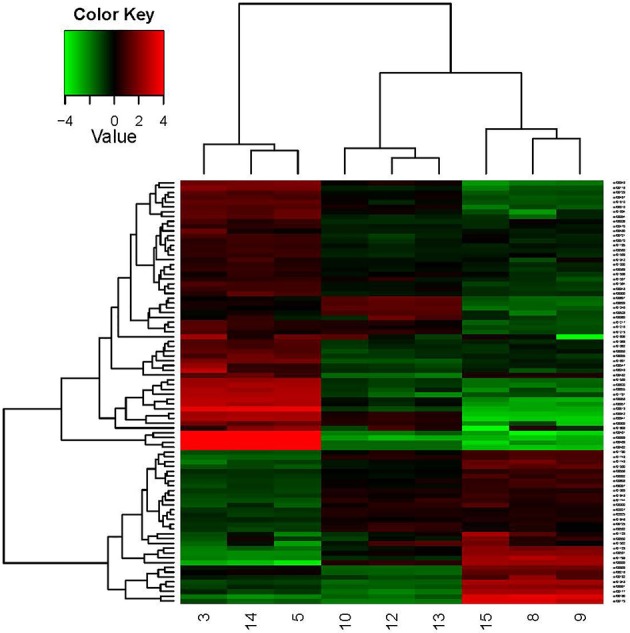
Figure 5.

Hierarchical clustering in heat map format of some DEGs shown in Table 4. Each horizontal row represents a differentially expressed gene, whereas each column represents a different growth condition. Green represents downregulated expression and red represents upregulated expression. Log2 values were used to cluster all the DEGs in Java TreeView by hierarchical clustering using Euclidean distance and pairwise average linkage methods. The number 9, 8, and 15 represent the three parallel samples of pH 4.8_0 h; The number 13, 12, and 10 represent the three parallel samples of pH4.8_1h; The number 3, 5,and 14 represent the three parallel samples of pH3.0_1h.
