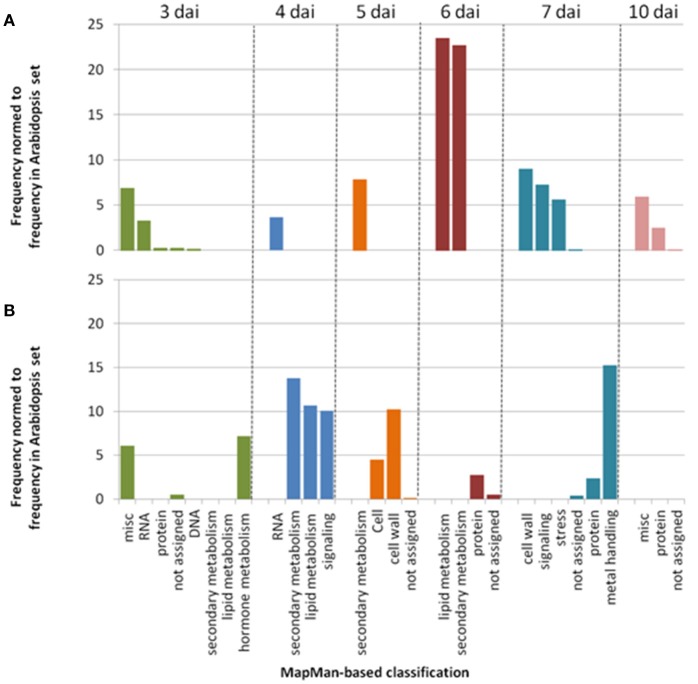
Figure 4.
Simplified representation of MapMan classification pathways found to be significantly over-represented (P < 0.01). Genes list were retrieved from enrichment tests performed using the SNPs in the 0.1% upper tail of the −log10 p-value distribution for each time point of phenotyping in the CUT (A) and UNCUT (B) conditions at 30°C (Tables S6, S7).

