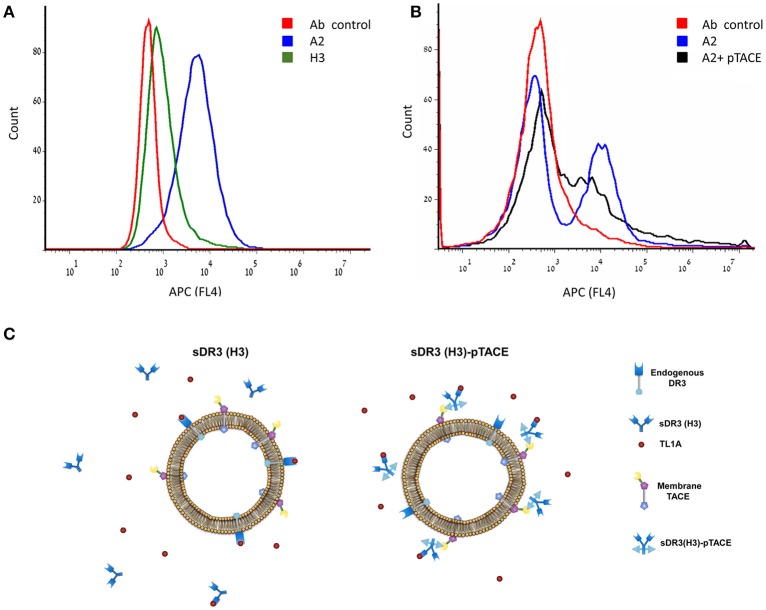
Figure 5.
High binding of the A2 bi-specific inhibitor to TF-1 cells through the pTACE domain. (A) Flow cytometry histogram analysis of gated TF-1 cell population incubated with A2 (blue), H3 (green) and antibody control (without the addition of the A2 or H3, red). Binding to the cell membrane was analyzed following incubation with allophycocyanin (APC) fluorescent anti-human Fc. (B) A2 binds cells through the pTACE domain. Shown is a competition experiment where 100 nM A2 was incubated with TF-1 cells in the presence or absence of 15 μM pTACE inhibitor that lacks an Fc region. A decrease in cell labeled population is observed in the presence of pTACE suggesting that A2 binds cells through endogenous membrane TACE. (C) A model for TL1A inhibition by the mono-specific soluble DR3 (H3) and the A2 bi-specific DR3 (H3)-pTACE. Left, binding of H3 to TL1A leads to depletion of free TL1A due to a competition with the endogenous DR3 membrane receptor. Right, the bi-specific H3-pTACE is bound to cell surface TACE located on the cell membrane leading to a high local concentration of the inhibitor on the cell membrane. This cell targeting leads to increased potency of inhibition of TL1A induced apoptosis in TF-1 cells by up to ~80-fold (Figure 4).

