
FIGURE 2.
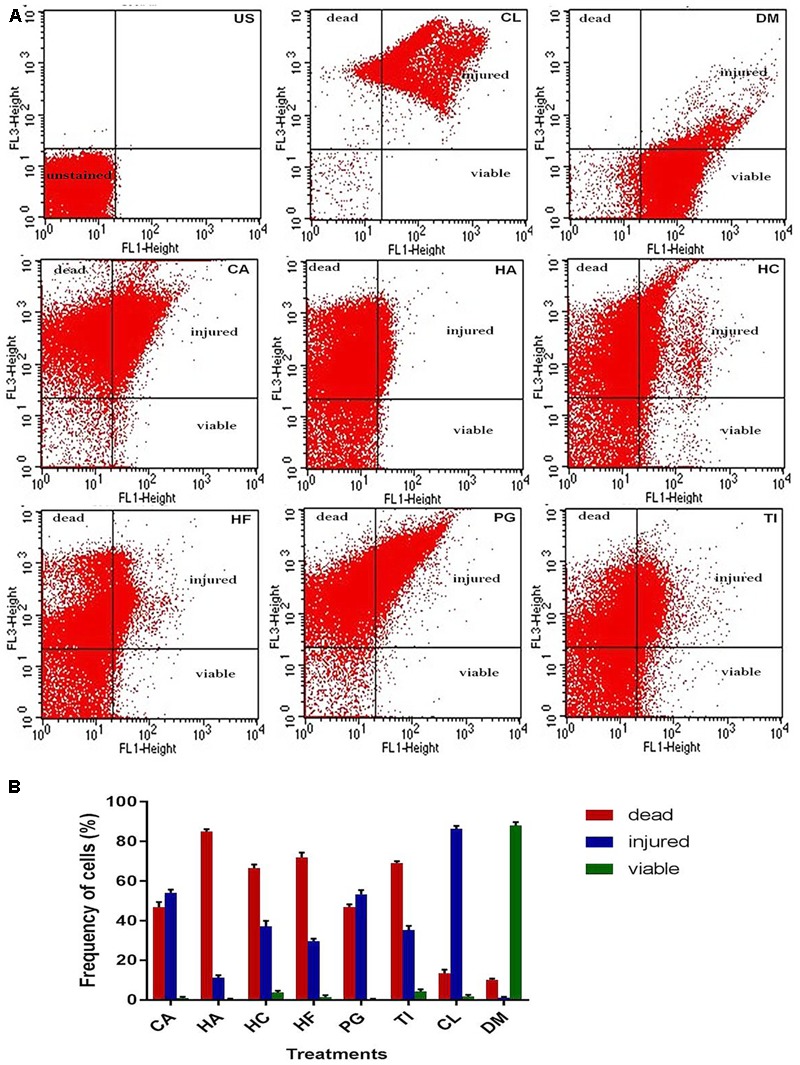
Flow cytometry viability analysis of NDM-1 E. coli cells based on SYTO 9 (FL1)/PI (FL3) dot plots (A) and estimation of frequency of live, injured, and dead cells (B) after the 4 h treatment with 2× MIC of plant extracts from CA, HA, HC, HF, PG, TI, 10 μg colistin (CL, positive control), and 20 μl DMSO (DM, negative control). The quadrants show unstained region (US), PI positive dead region (bacterial cells with irreversibly damaged membranes), SYTO 9 positive live region (bacterial cells with intact plasma membranes), and PI/SYTO 9 double positive injured region (bacterial cells with different degree of disrupted membranes).