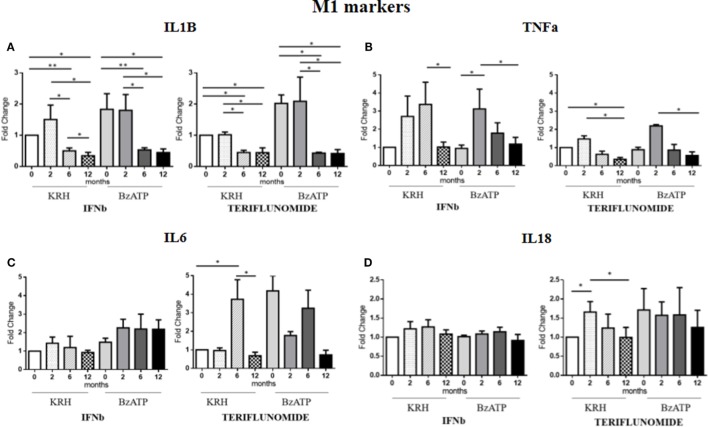
Figure 3.
Expression level of M1 markers evaluated by RT-PCR: interleukin-1β (IL-1B) (A), TNFalpha (TNFa) (B), IL-6 (C), and IL-18 (D) in unstimulated Krebs-Ringer solution (KRH) or benzoyl-ATP (BzATP)-stimulated monocytes in MS patients at baseline and after 2, 6, and 12 months of treatments with interferon-beta (IFNb) and teriflunomide. Data are expressed as mean ± SEM of fold change values (*p < 0.05; **p < 0.01; ***p < 0.001).

