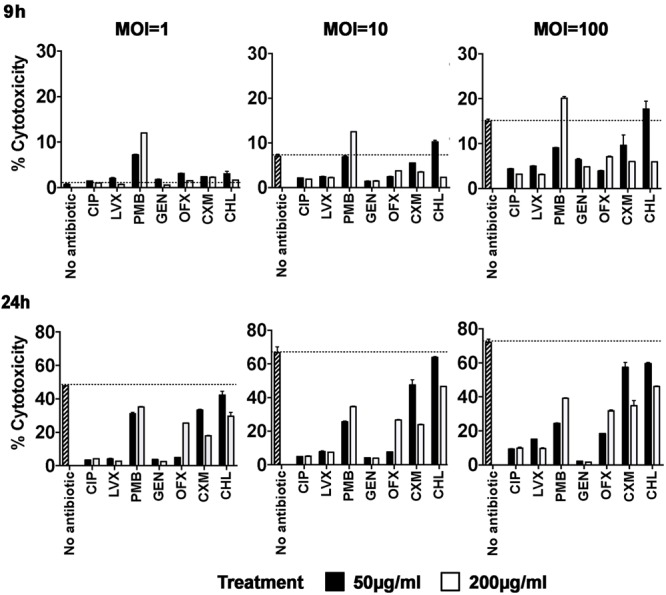
FIGURE 2.

Cellular toxicity induced by P. aeruginosa infection of hCFs in the presence of different antibiotics. hCF monolayers were infected with P. aeruginosa at MOI = 1, 10, and 100, and CIP, LVX, PMB, GEN, OFX, CXM and CHL (50 and 200 μg/mL) was added to each monolayer at 3 h post initial infection. LDH release was measured from supernatants after 9 and 24 h of each antibiotic treatment and the percentages of cytotoxicity were calculated following the manufacturer’s instructions. Non-antibiotic treated and infected hCF monolayers were used as controls. The columns represent the mean percentage of cytotoxicity measured as LDH release from monolayers from n = 3 independent experiments and the error bars represent the standard error of the means (SEM). A one-way ANOVA with Dunnett’s multiple comparison test was used to compare the percentage cytotoxicity levels observed with the antibiotic treatments against the different MOI with the no treatment control, at both 9 h and 24 h.
