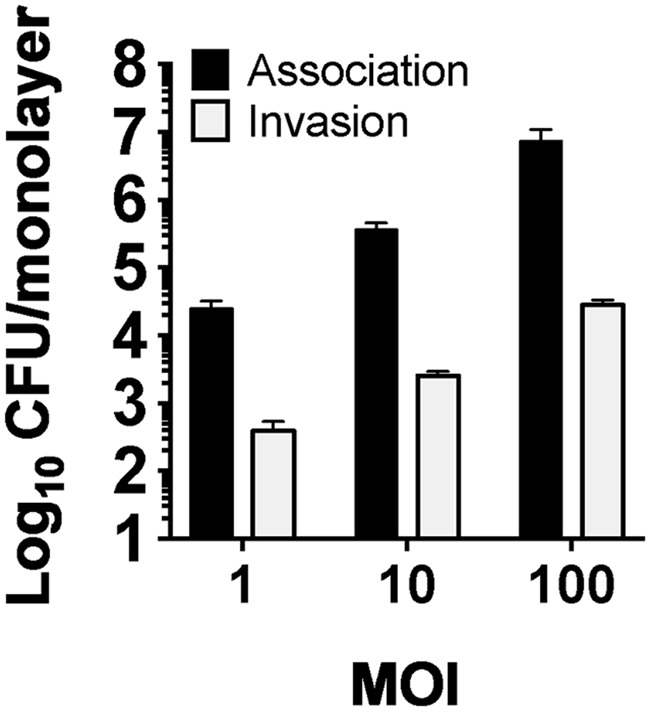
FIGURE 3.

Association of PAO1 to hCF monolayers and subsequent invasion. The graph shows the association of PAO1 to hCF-monolayers after 3 h of infection at MOI = 1, 10, 100, and the levels of invasion measured by quantifying intracellular PAO1 CFU after 90 min of GEN treatment at 200 μg/mL (using a standard gentamicin protection assay). The columns represent the mean CFU/monolayer and the error bars the standard error of the mean (SEM) of n = 3 independent experiments.
