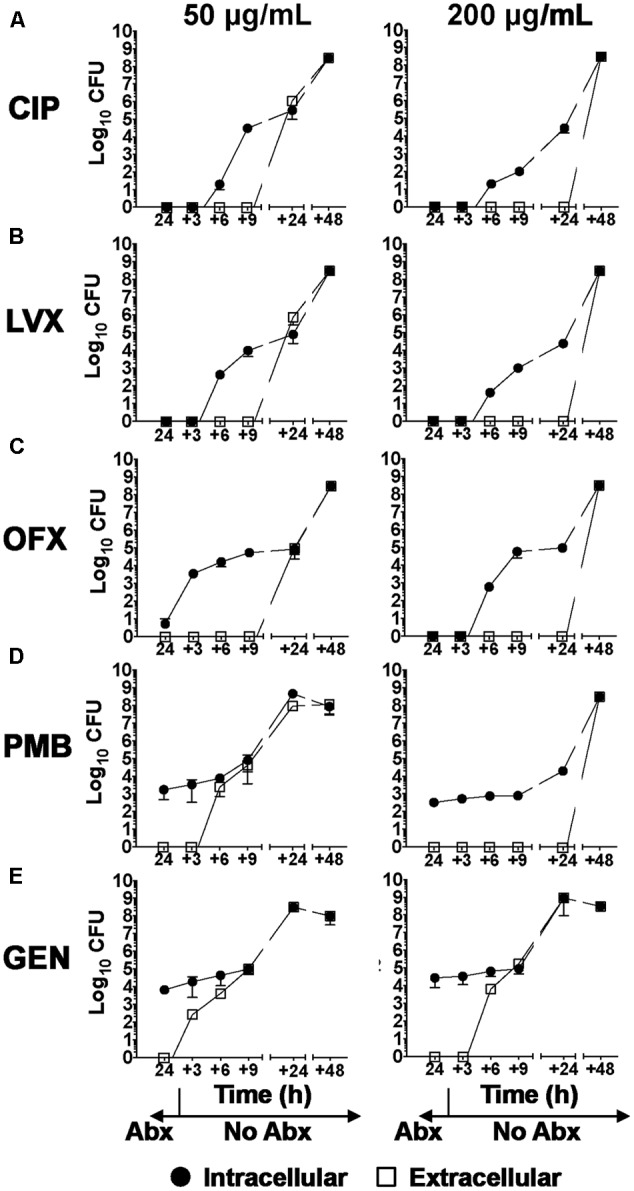
FIGURE 5.

Intracellular and extracellular P. aeruginosa growth after cessation of antibiotic treatment of infected hCFs. Intracellular and extracellular PAO1 growth after 3, 6, 9, 24, and 48 h of hCFs infected with PAO1 at MOI = 1 post 24 h treatment with CIP, LVX, PMB, GEN and OFX antibiotics (Abx). CFU enumerated intracellularly by viable counting are shown per monolayer, and measurements of extracellular PAO1 are shown per mL. The symbols represent the mean of extracellular and intracellular PAO1 enumerated in the different treatments and time-points and the error bars the standard error of the mean from n = 3 independent experiments. A one way ANOVA with Dunnett’s multiple comparison test was used to compare the intracellular and extracellular CFU numbers at each time point (+3 to +48 h) after removal at 24 h of each antibiotic concentration (50 and 200 μg/mL). All calculated P values are shown in Supplementary Table S3.
